We’re thrilled to release our latest and greatest TikTok Benchmark Report aimed at helping you figure out how your brand is doing on TikTok against thousands of other brands in top industries.
Our comprehensive report includes metrics like engagement rates, hashtags, posting frequency, mentions, and so much more alongside standout examples from top performers. We also broke things down by industry so you can figure out exactly how your brand is doing against the competitive benchmarks that matter most.
Read on for all the info your brand needs to outperform your competition on the #FYP and beyond this year.
Key TikTok Benchmarking Takeaways
TikTok is out-engaging other channels.
Median brands are earning an average eng. rate per follower of 5.7% on TikTok, which is about 50% higher than last year and 12x the next most engaging channel, Instagram.
Mentions matter.
Brands are seeing an engagement boost when they include mentions in their videos, and you can bet those mentions are helping with follower growth as well.
Health & Beauty, Higher Ed, and Sports Teams dominate.
These industries are consistently at the top of the pack across other social channels we study, so it’s not too surprising that their content is engaging fans on TikTok too.
Posting frequency is flat on TikTok.
The average brand posts to TikTok just 1.7 videos per week compared to last year, which is on par with last year’s frequency. It’s clear that brands are still finding their footing on TikTok.

Grab the full report with even more TikTok #inspo.
Download the full reportTikTok Videos per Week
We get the question, “How often should my brand be posting on social media?” a lot, because fine-tuning your posting frequency really matters. Benchmarking your brand’s TikTok posting frequency against a) brands of a similar size and b) competitors in your industry is the best way to figure out how many videos per week you should be aiming to post.
TikTok Videos per Week: Distribution
The average brand in this study publishes about 1.75 videos per week, or about 8 per month.
- The top 20% most active brands published videos at least 5 times per week on average.
- A full 32% of brands publish less than once a week.
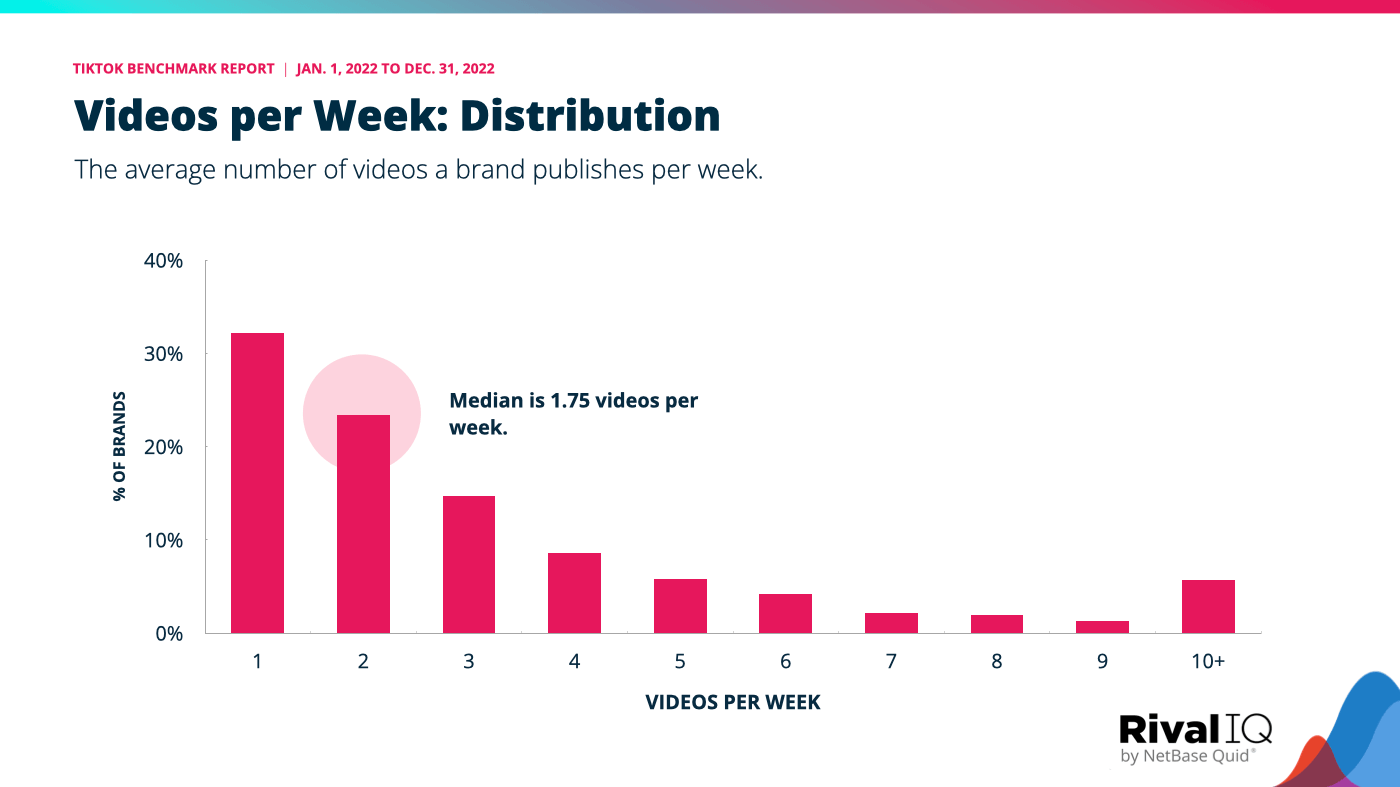
Creating compelling videos for TikTok is definitely an investment for brands. The median posting frequency here is about half of what we see for Instagram posts in our annual social media benchmark report.
TikTok Videos per Week: Account Size
The larger your account, the more likely you are to publish more frequently.
- The smallest bin we studied (1K-5K followers) averaged about 1 video per week.
- Accounts with 200K+ followers post 3 or more times per week.
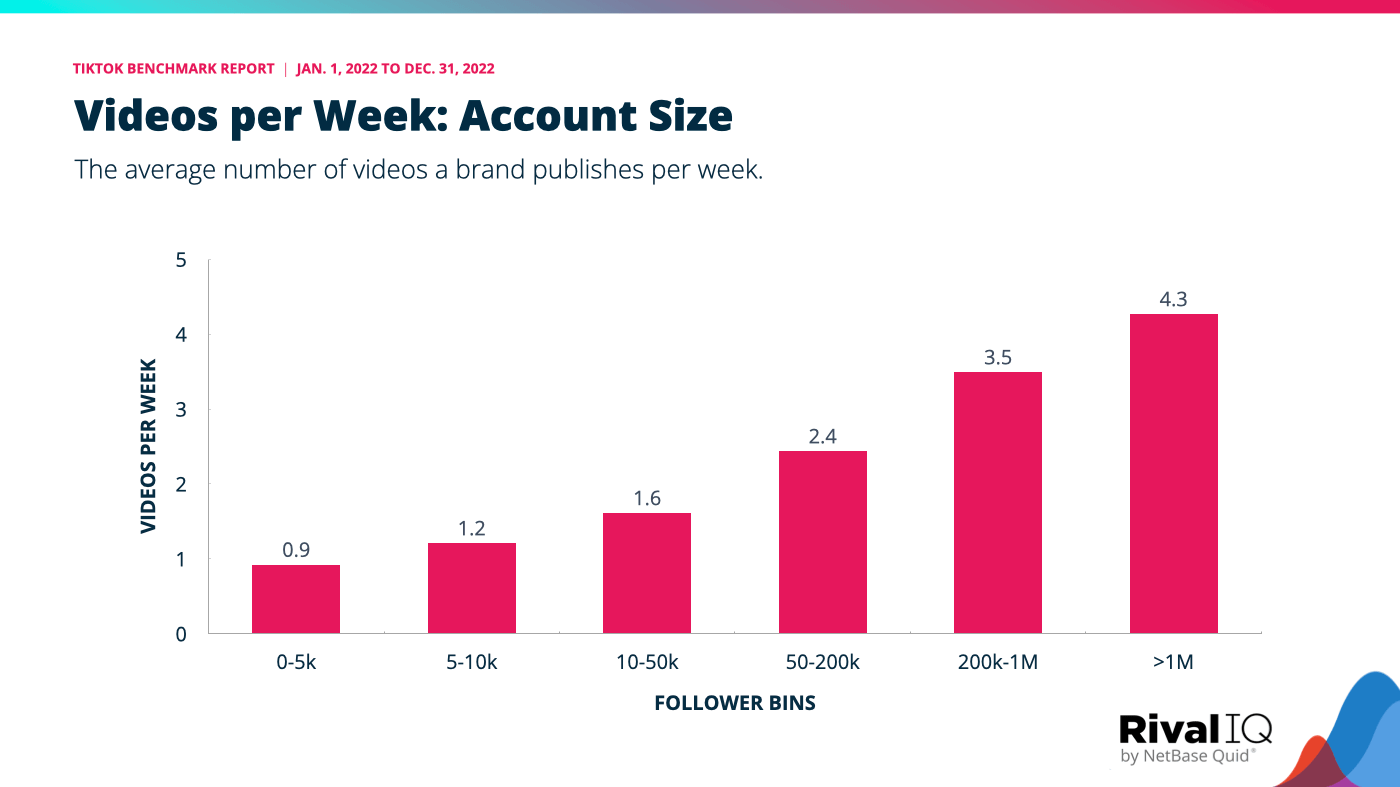
It’s not surprising to see this correlation between follower count and posting frequency. Of course, having more followers doesn’t make you post more. Rather, accounts that consistently post a higher volume of quality videos are going to grow their accounts. As they grow, we see the investment in posting grow along with it.
TikTok Videos per Week: Industries
There’s a wide range of frequencies as we examine posting behavior by industry.
- Media brands top the charts with the average brand posting more than four times per week.
- The least active industries, Alcohol and Food & Beverage, publish slightly more than once a week.
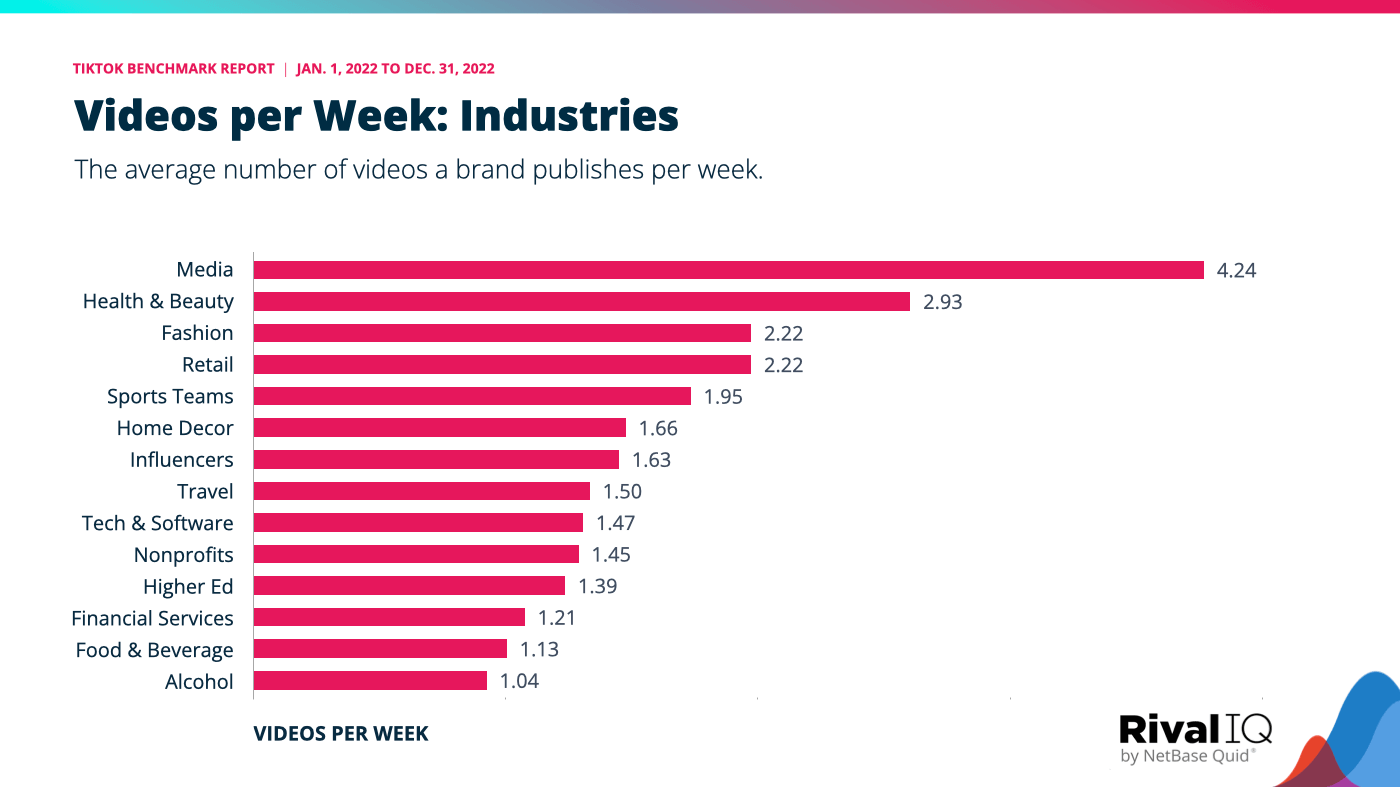
Media and Health & Beauty are usually prolific posters, so their TikTok frequency is no surprise. The same can be said for the lower posting frequencies of Alcohol and Food & Beverage brands.
Most industries are posting less often on TikTok than on Instagram.
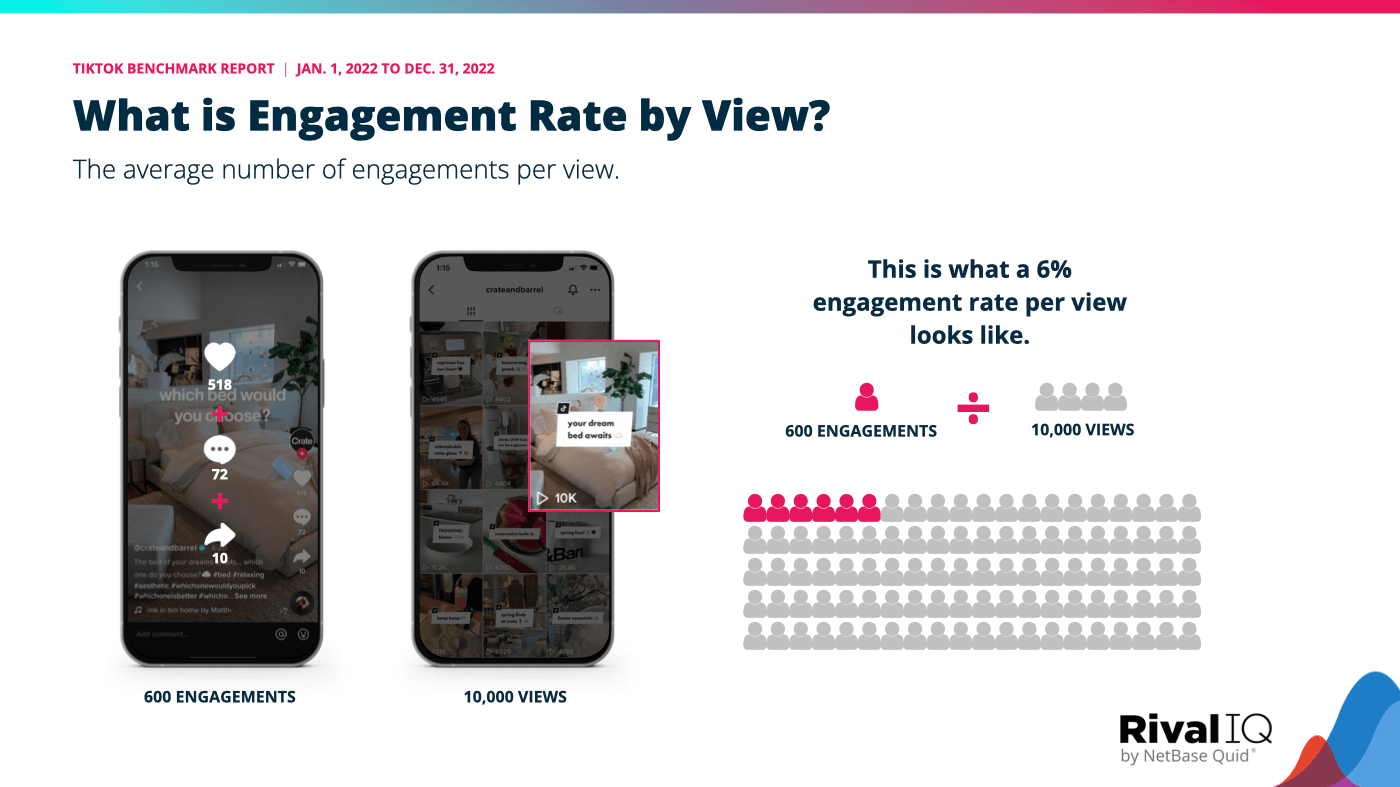
Engagement Rate by View
Engagement Rate by View on TikTok is one of the best measures of a video’s quality. Why? Counting the number of times a viewer liked, commented, or shared and dividing it by the overall number of views measures just how compelling your content was. If your video wasn’t high-quality or attention-grabbing, viewers will be less likely to engage with it, and therefore you’ll earn a smaller engagement rate per view. If your video attracted attention, viewers will be more likely to take the extra step of engagement before swiping to the next video.
Engagement Rate by View: Distribution
The average brand in our study earns an engagement rate by view of 4.15%.
- Only about 16% of brands earn double-digit percentages for engagement rate by view.
- Low engagement rates by view are an indication that boosting is a substantial part of the reach for a video. About 14% of brands average less than 2% across all their videos, suggesting they’re boosting an appreciable portion of their videos.

Engagement rate by view is a roughly comparable metric to engagement per impression that we see on other platforms like Instagram. In our most recent Instagram report, we noted that brands have been consistently earning a 4.3% engagement per impression.
Engagement Rate by View: Account Size
With one exception, average engagement rate by view grows with follower counts.
- Brands with 200K-1M followers have an average of 6.6% engagement rate per view, which is nearly double what smaller brands are seeing.
- The largest accounts, with more than 1M followers each, are reaching an engagement per view of 7.5%.

Given the strong role that the FYP algorithm plays in the world of TikTok, it isn’t surprising to see a positive correlation between account size and engagement rate by view. Brands with large followings didn’t get that way by creating mediocre content. Consistently producing high-engagement videos is a sure way to grow your following.
Engagement Rate by View: Industries
Sports Teams, Nonprofits, and Influencers top the list when it comes to highly engaging content.
- Sports Teams in this report average an eye-popping 9.7% engagement rate by view.
- On the low end, Health & Beauty, Home Decor, and Financial Services brands sat well below the report-wide average of 4.15%.

As we see in other industry-level studies we’ve done in the past, Sports Teams, Nonprofits, Influencers, and Higher Ed gather relatively high engagement from fans. For each of these industries, viewers are passionate about their team, school, or causes much more than they are for their favorite brands.
Engagement Rate by View Standout Performer: Oklahoma City Thunder
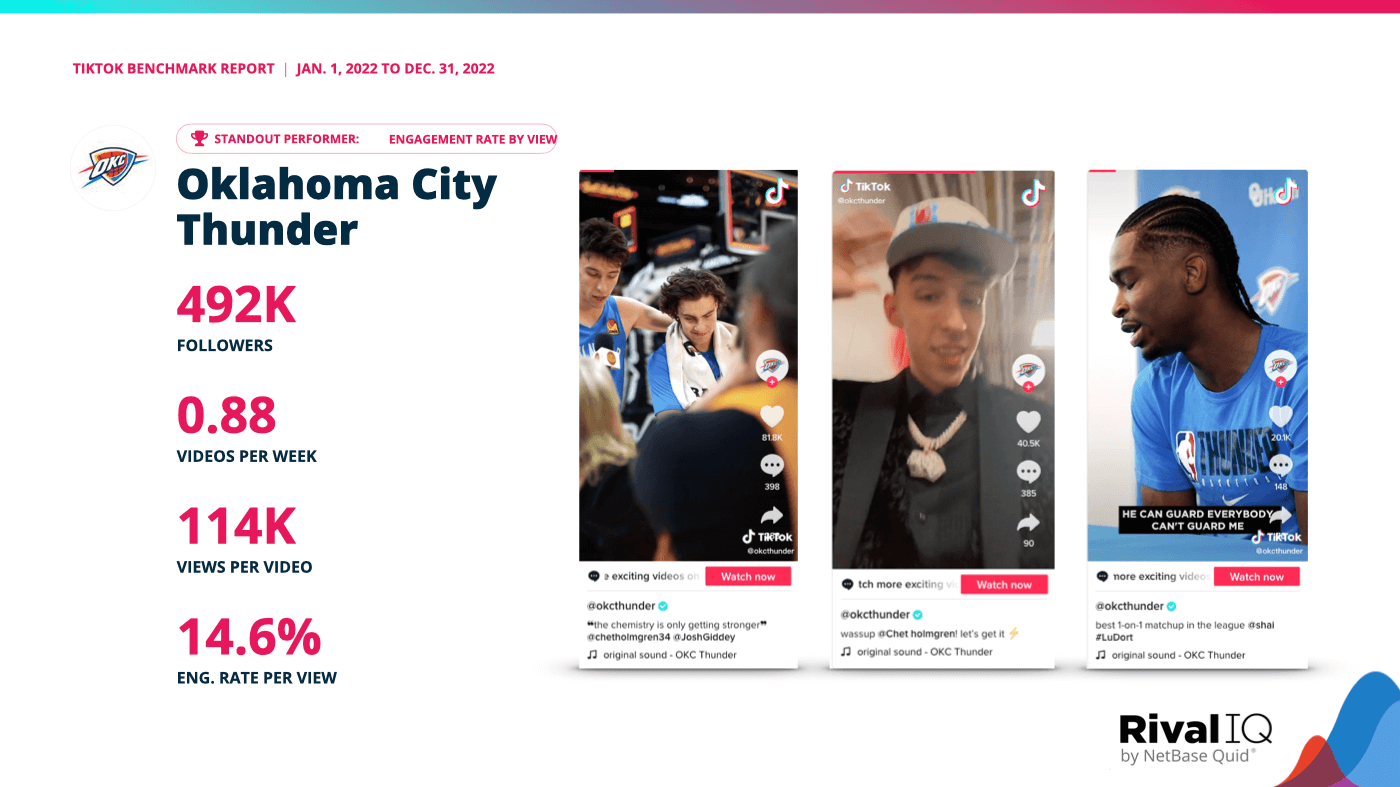
Oklahoma City Thunder brought the TikTok thunder this year by featuring team interviews, stories, and takeovers front and center. The Oklahoma-based NBA team rocked a 14.6% engagement rate per view thanks to engaging videos that went beyond the basketball court.
Fans ate up videos that featured players talking about their performance post-game or behind-the-scenes footage of what they get up to on the weekends. The OKC social media team also seemed determined to help fans fall in love with cute lanky basketball players with more than a few thirst traps.
Views per Follower
TikTok’s For You Page has revolutionized social media by emphasizing content the algorithm thinks you’ll like over content from creators you follow. As a result, it’s important for brands to make sense of how videos are reaching followers and non-followers alike, and benchmarking your brand’s views against your followers is a useful engagement metric for understanding how your views stack up against your follower count.
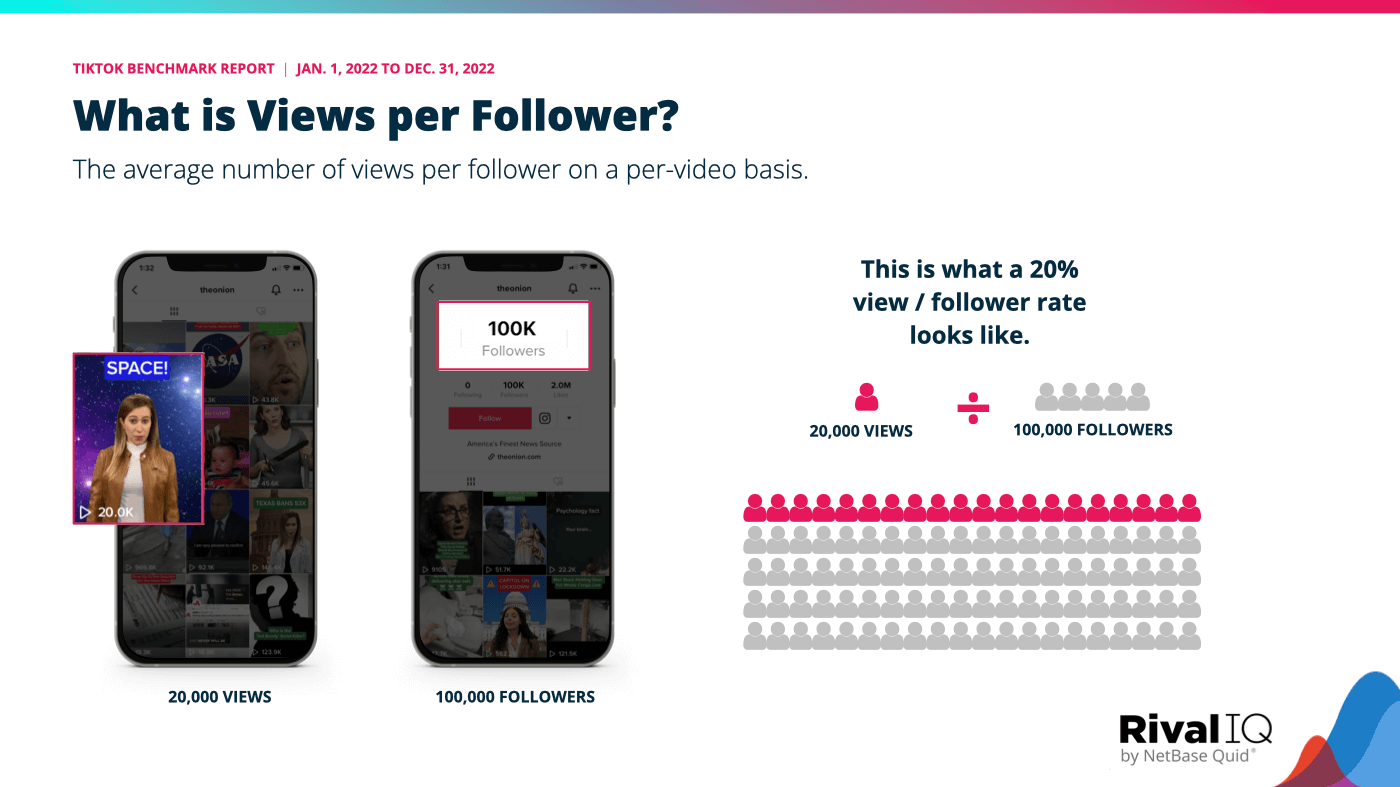
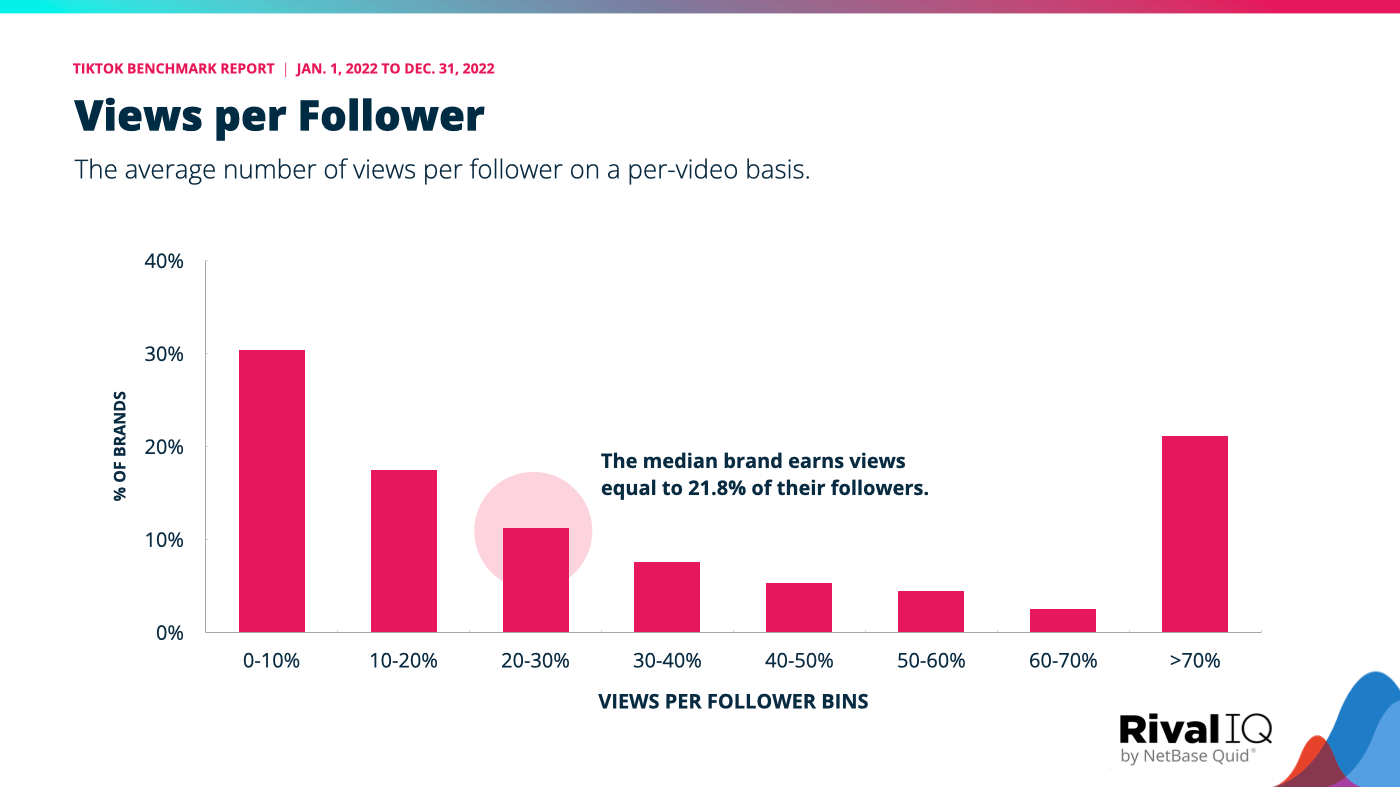
The average brand in our study earns about 21.8 views per 100 followers on each video they post.
- Though most brands don’t achieve at such a high rate, the top 25% of brands earn more than 50 views per 100 followers per video on average.
- On the low end, more than 30% of brands earn fewer than 10 views per 100 followers, on average.
The higher percentage of followers you reach, the more resonant your content is, and the more TikTok’s infamous algorithm will continue to serve your content to the people it thinks will be most likely to engage with it.
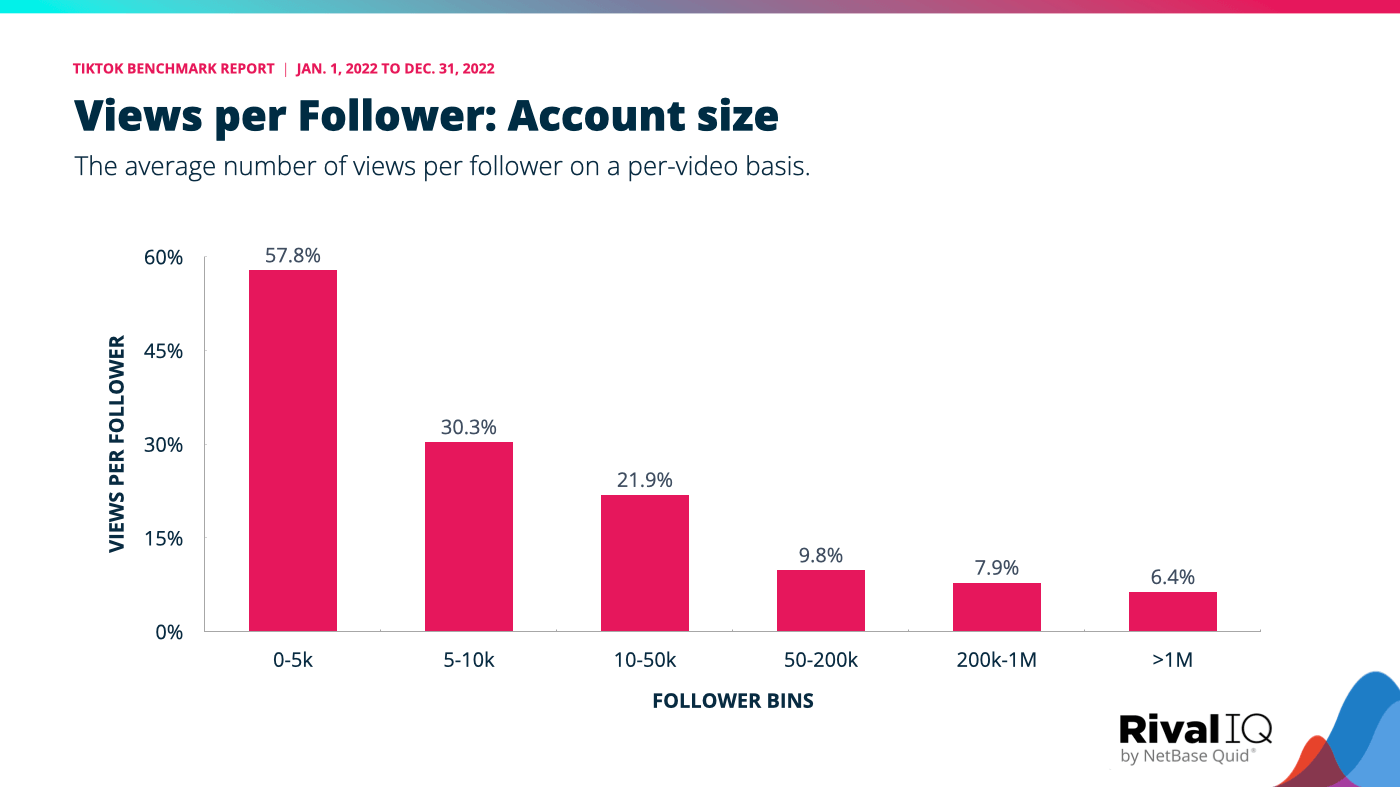
Views per Follower: Account Size
In general, we find that the larger the number of followers, the lower the views per follower.
- Accounts with fewer than 5,000 followers average about 57 views per 100 followers on each video.
- That ratio decreases with accounts between 200K-1M followers averaging just 8 views per 100 followers on each video.
It isn’t surprising to see that views per follower decline, on average, as accounts grow in size. This dynamic is one that we also see on other platforms like Instagram. Smaller accounts tend to post less frequently, which also helps increase the views on each individual video.
Views per Follower: Industries
Higher Education, Sports Teams, and Travel earn the highest views per follower of the industries we studied.
- Colleges and universities are earning 2.5x the views per follower of the next best industry, Sports Teams.
- Media brands and Influencers lag behind the cross-industry median, earning less than 13% on average.
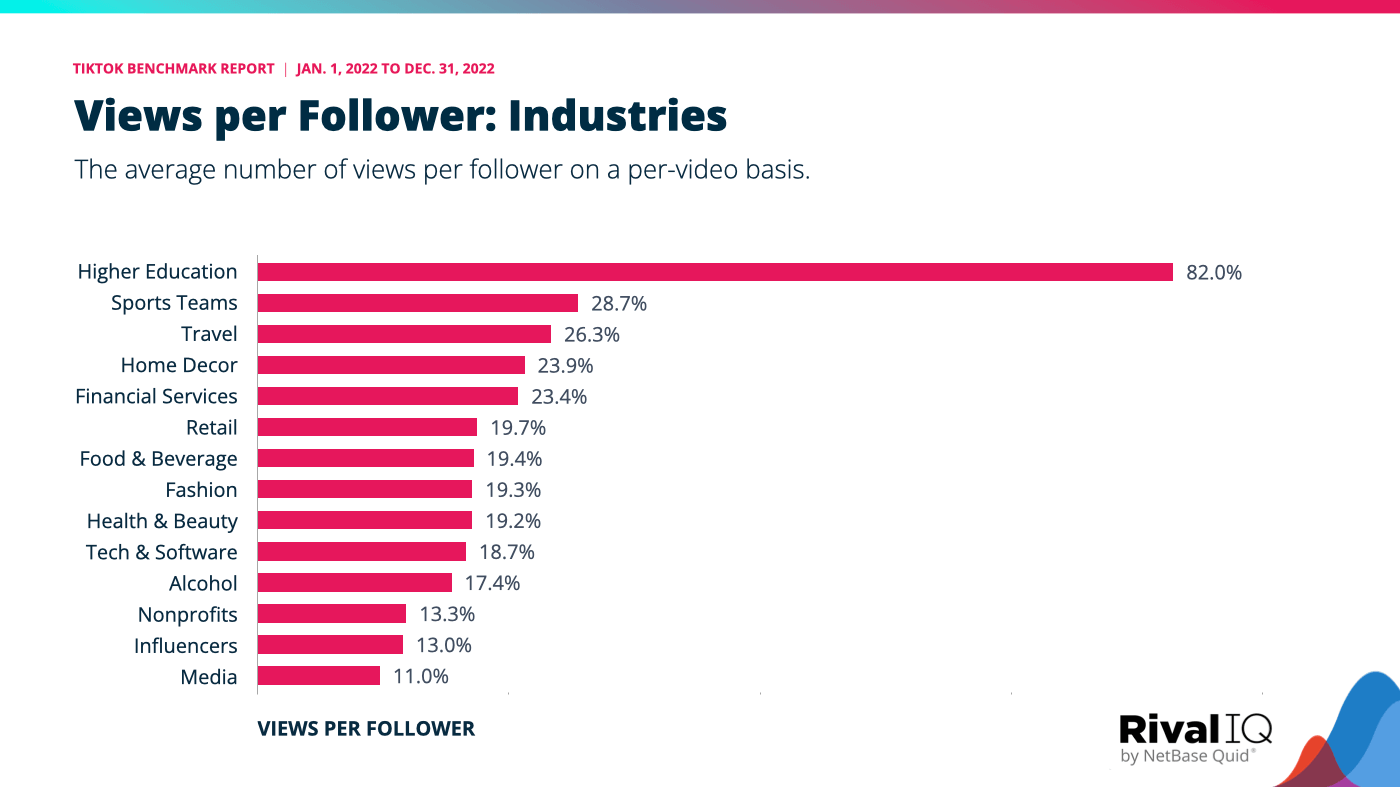
As usual, Higher Ed and Sports Teams are killing it with this engagement metric. It’s worth noting that Higher Education accounts are relatively small compared to Sports Teams, driving their average views per follower higher in this analysis.
Views per Follower Standout Performer: Harvard University
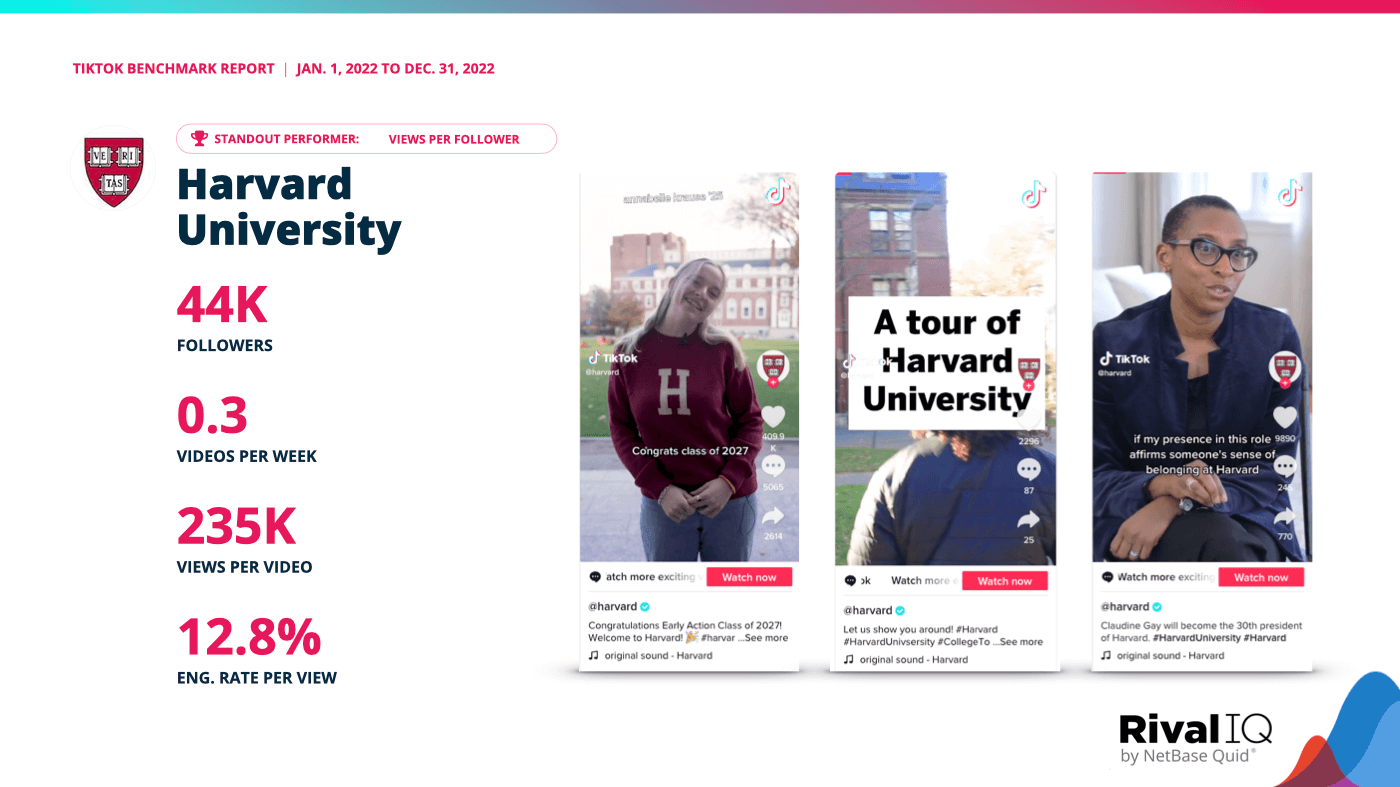
With 23.8 views/follower per 100 followers, Harvard University leads the pack in more than just IQ points. A mix of standout videos and evergreen faves helped the Boston-based university earn millions of views on just 16 videos, reminding us that more isn’t always more.
Videos about campus traditions and celebrity visitors earned tons of views, but Harvard managed to really stand out on TikTok this year with a few killer videos about admissions and new Harvard president Claudine Gay.
Want to see what other top colleges and universities are up to on TikTok? Peep our Higher Education Social Media Engagement Report for the latest.
Engagement Rate by Follower
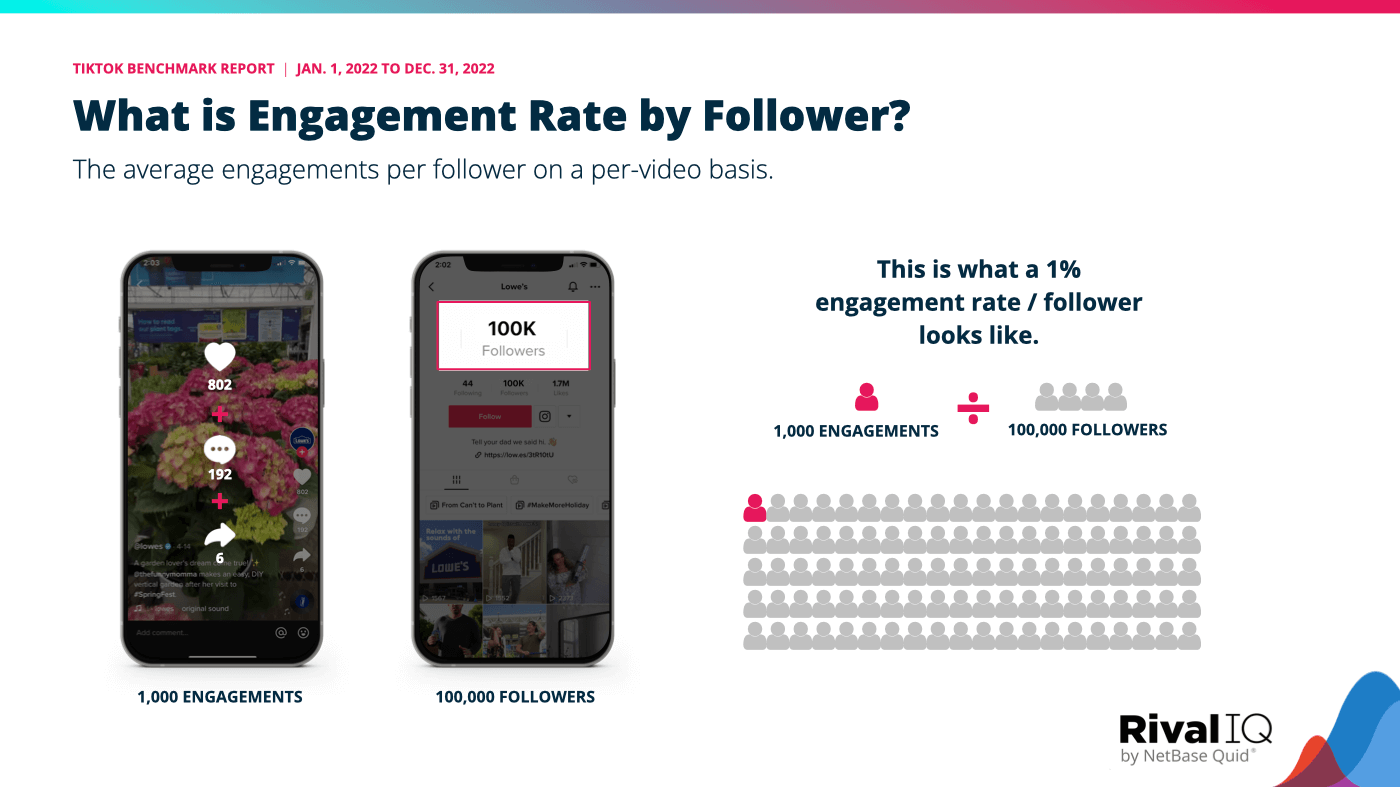
If you’ve ever read a Rival IQ benchmark report before, you won’t be surprised to see our most-used engagement metric making an appearance on TikTok too. Engagement rate by follower helps users control for audience size when measuring engagements on social. It’s crucial to go beyond engagement total because audience size is hugely important: 200 likes is great engagement for a brand with 2,000 followers but is a drop in the bucket to a brand with 200,000 followers.
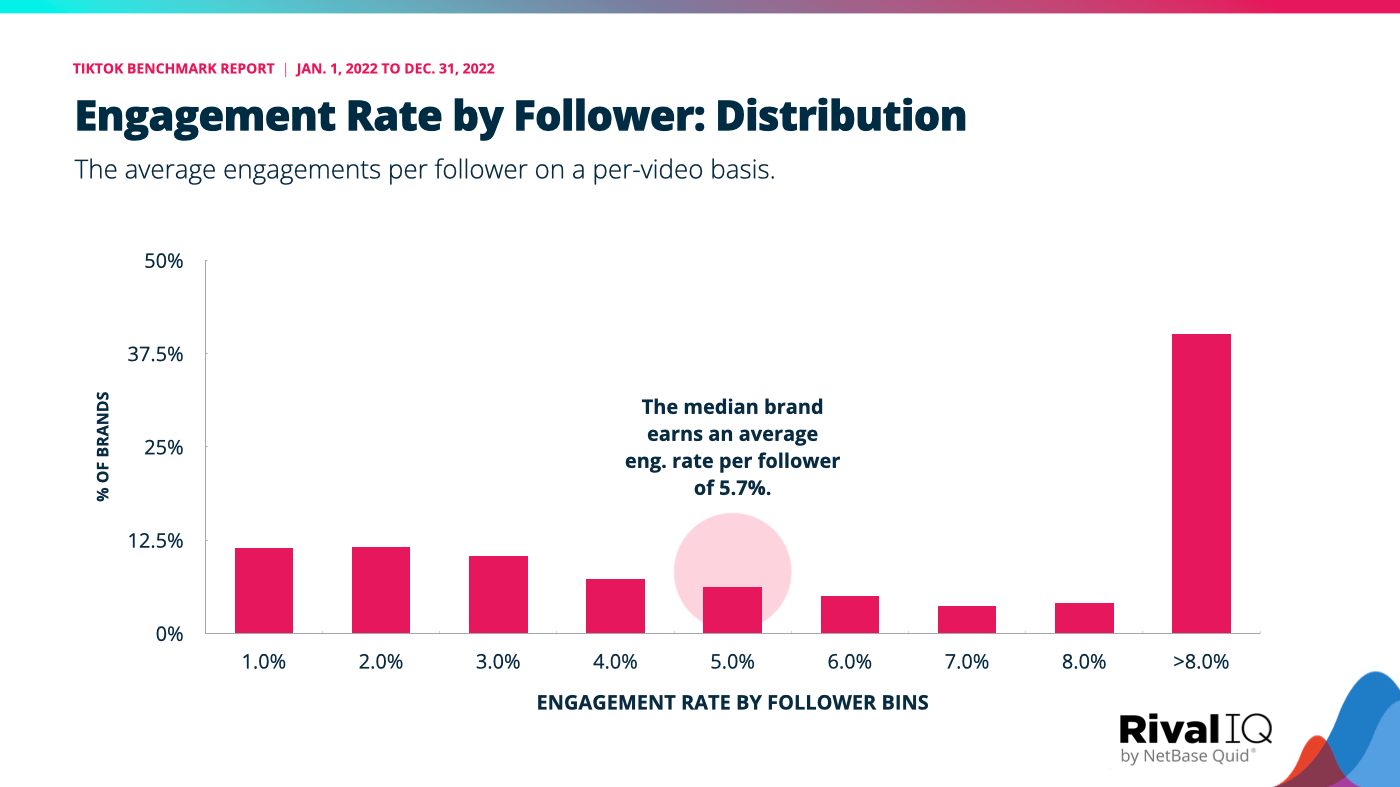
Engagement Rate by Follower: Distribution
On a per-video basis, the engagement rate by follower for the median brand comes in at 5.7%.
- About 40% of brands earn an engagement rate by follower of more than 8%, which is about 50% more than the median.
- On the lower side, a third of brands also average an engagement rate of less than 3%.
We share this engagement rate to help brands understand their TikTok performance relative to other social media channels. The engagement rates per follower brands are earning right now on TikTok dramatically outpace those of other channels, with Instagram being the next closest.
Engagement Rate by Follower: Account Size
On average, brands with larger accounts see lower engagement rates by follower on average.
- Accounts with fewer than 50K followers see their average engagement rates come in above the median brand at 5.7%.
- The largest accounts, those with more than 1 million followers, see their per-video average engagement per follower come in at roughly 2.5%.
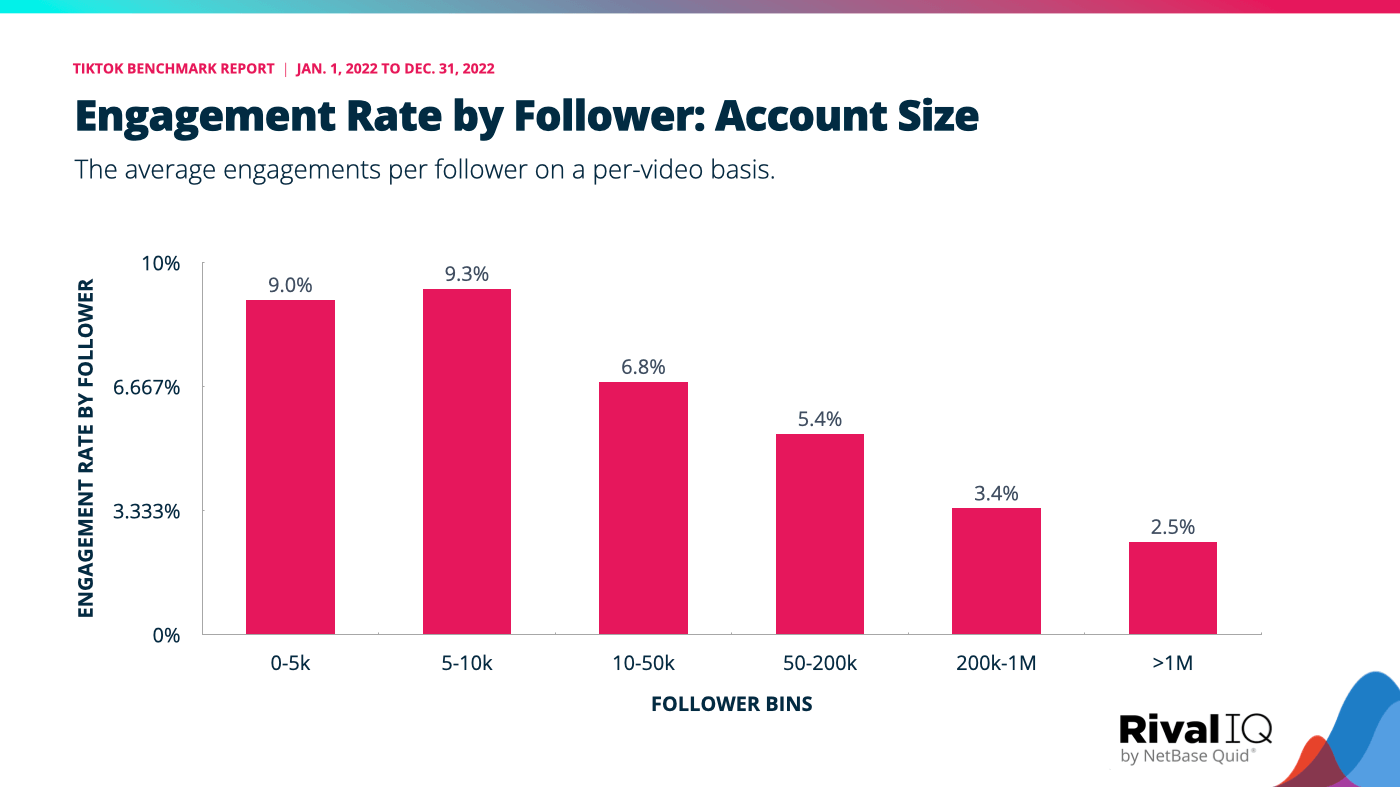
There are multiple factors that drive engagement rate, including average video reach and content quality. As we saw in the previous section, larger accounts tend to earn fewer views per follower on average.
Engagement Rate by Follower: Industries
Higher Education and Sports Teams top the list for engagement rate by follower with performance well beyond the cross-industry average.
- Travel, with an average engagement rate of 7.4%, rounds out the top 3 industries.
- Health & Beauty brands and Influencers perform well below the cross-industry average.
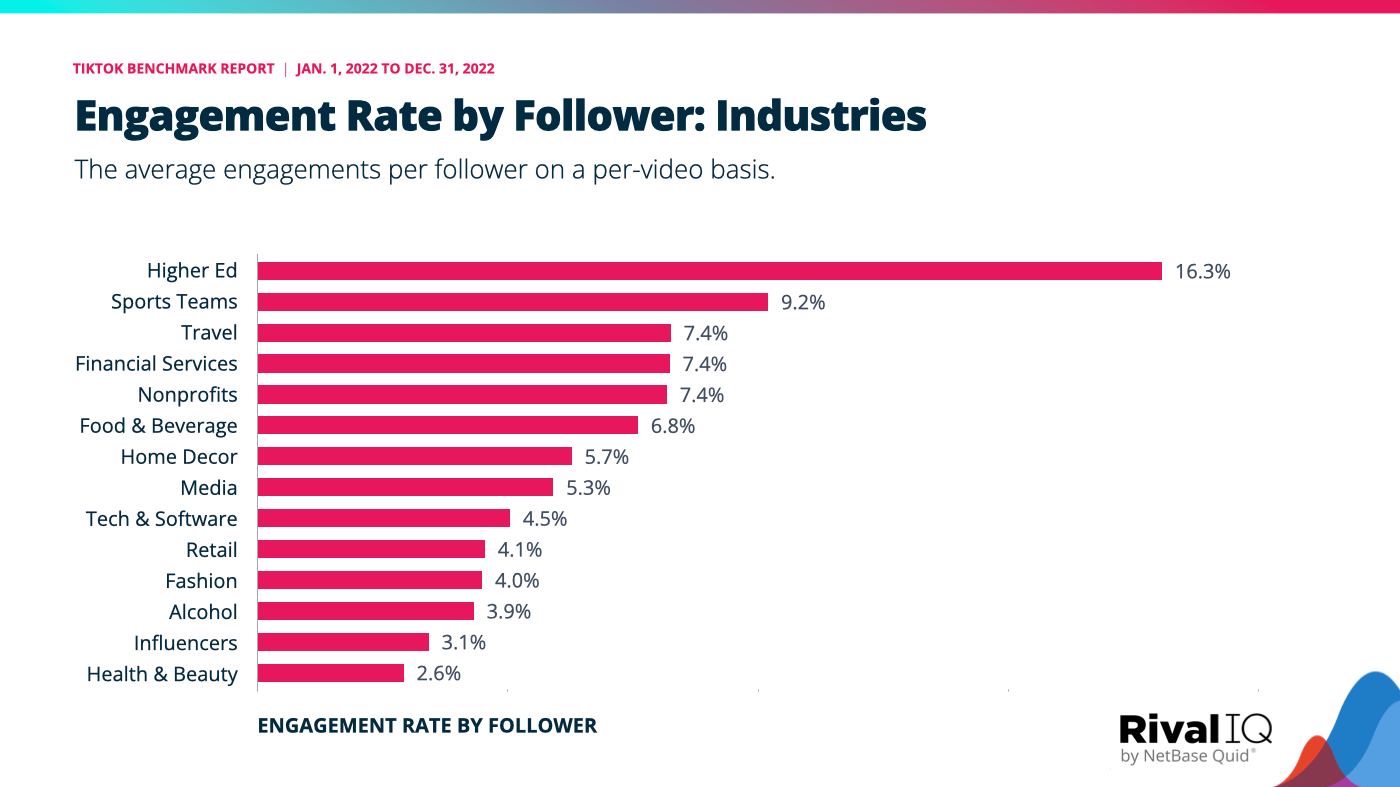
Similar to the performance we saw for views per follower, Higher Ed, Sports, and Travel out-earn other industries for the average engagement rate by follower metric. Combining above average reach with content their audiences are excited about is a surefire way to yield high per-follower engagement.
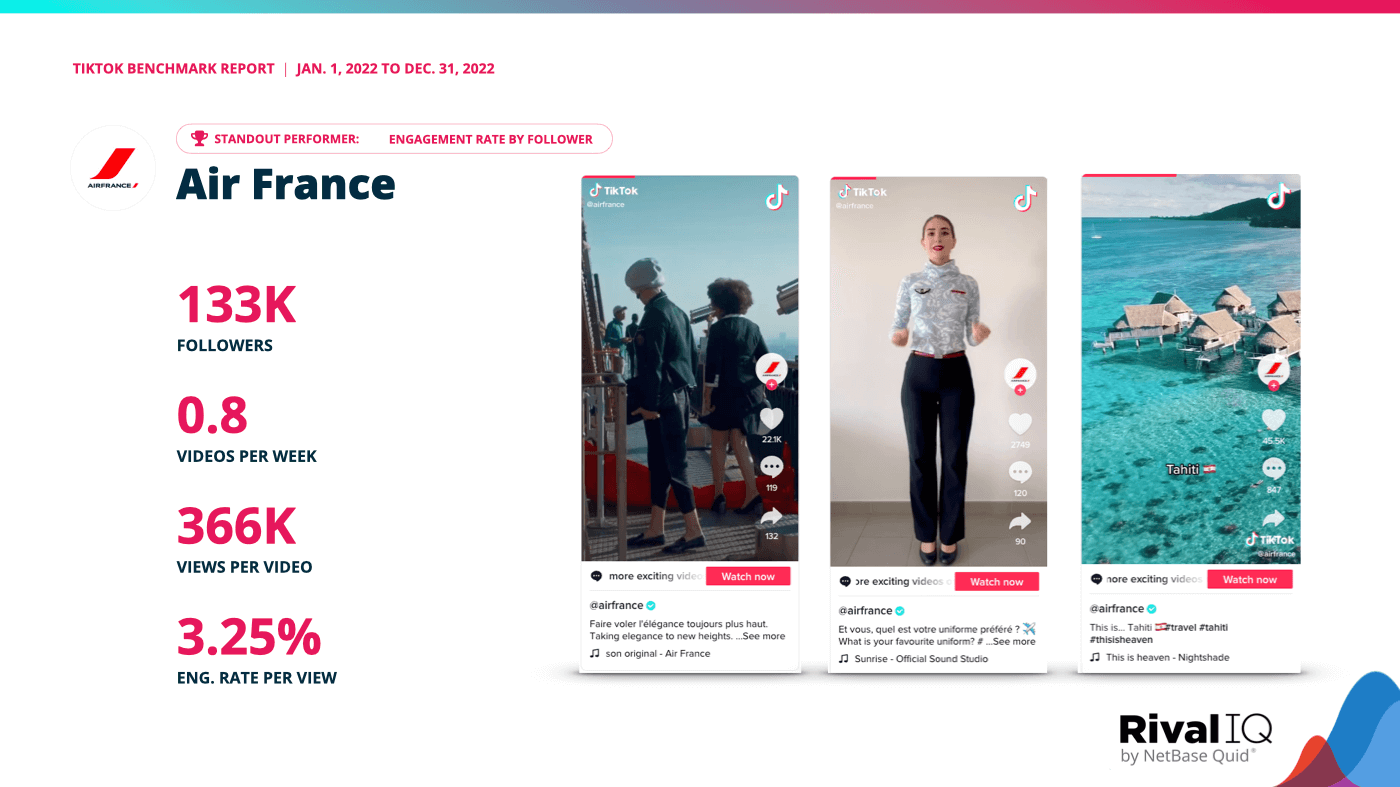
Engagement Rate by Follower Standout Performer: Air France
Air France rocked a 22.5% engagement rate by follower on TikTok this year thanks to bilingual travel thirst traps that made wannabe travelers run to smash the like button or leave a comment.
The airline took travelers to France, Tahiti, Cannes, and every airport in between in engaging, highly-produced videos that inspired engagement. Followers also enjoyed behind-the-scenes footage from new planes to exclusive peeks at Air France uniforms.
Posting regularly helped Air France earn consistent engagement throughout the year and is a good strategy for any brand looking to score likes and comments on TikTok.
Average Monthly Follower Growth
TikTok’s growth has been explosive over the last few years, so it’s useful for brands to measure their own growth to see if they’re increasing their audience size or not.
Across all account sizes, brands on TikTok are growing their followers at least 2-3% on a monthly basis.
- Smaller accounts with fewer than 50K followers average monthly growth of more than 4%.
- The larger accounts in this study are growing at a rate of 2.5% or more per month.
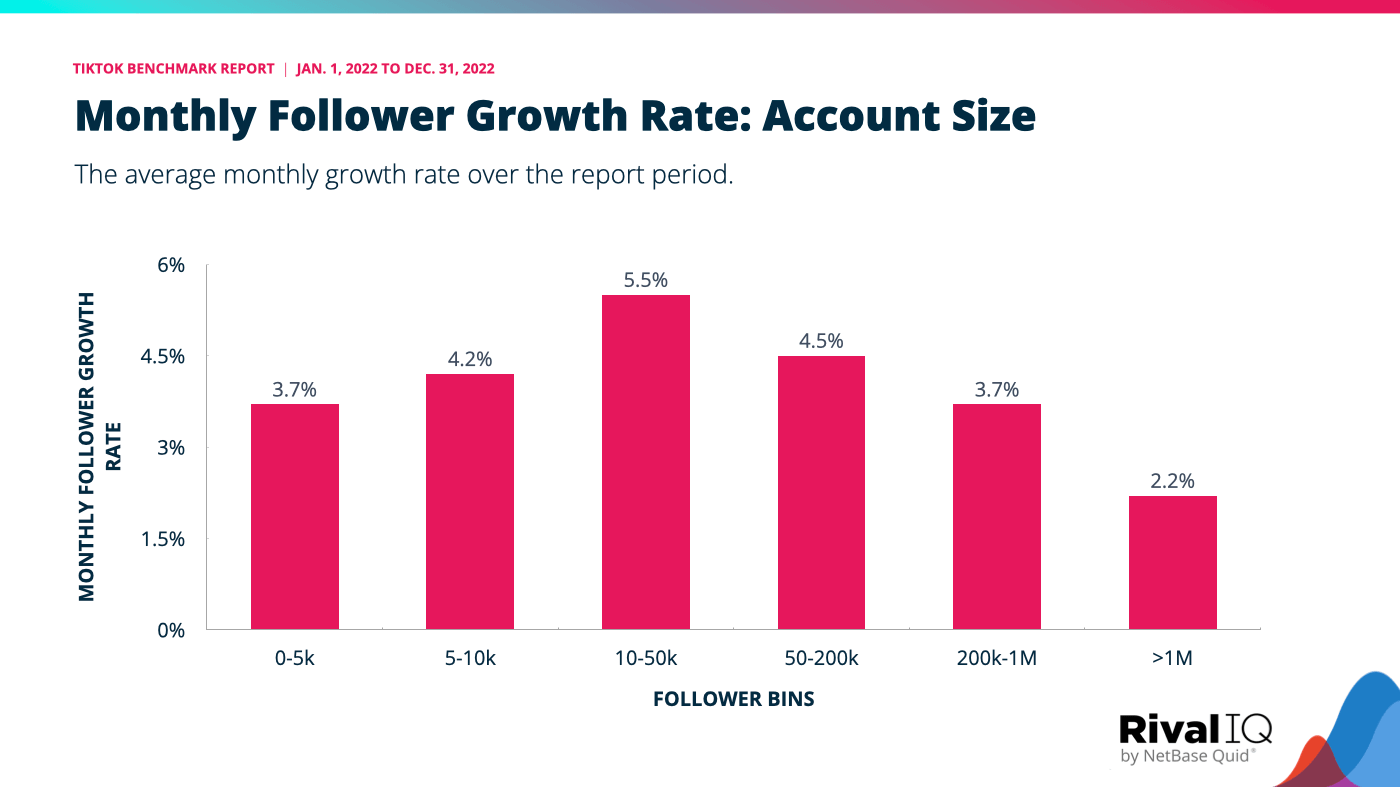
TikTok is very much a growing platform, and we see brands of all sizes successfully growing their accounts. This shouldn’t be surprising given that TikTok has been the most downloaded app in the US for the last several years.
Hashtags per Video
Brands are using hashtags to entice viewers and to give TikTok a clue as to what their content is about to increase the chance of landing on the coveted #FYP.
Brands include about four hashtags per video on average.
- Brands lean towards fewer hashtags, with just 39% of brands including 5 or more hashtags in their videos.
- 14% of brands include one or fewer hashtags in their videos.
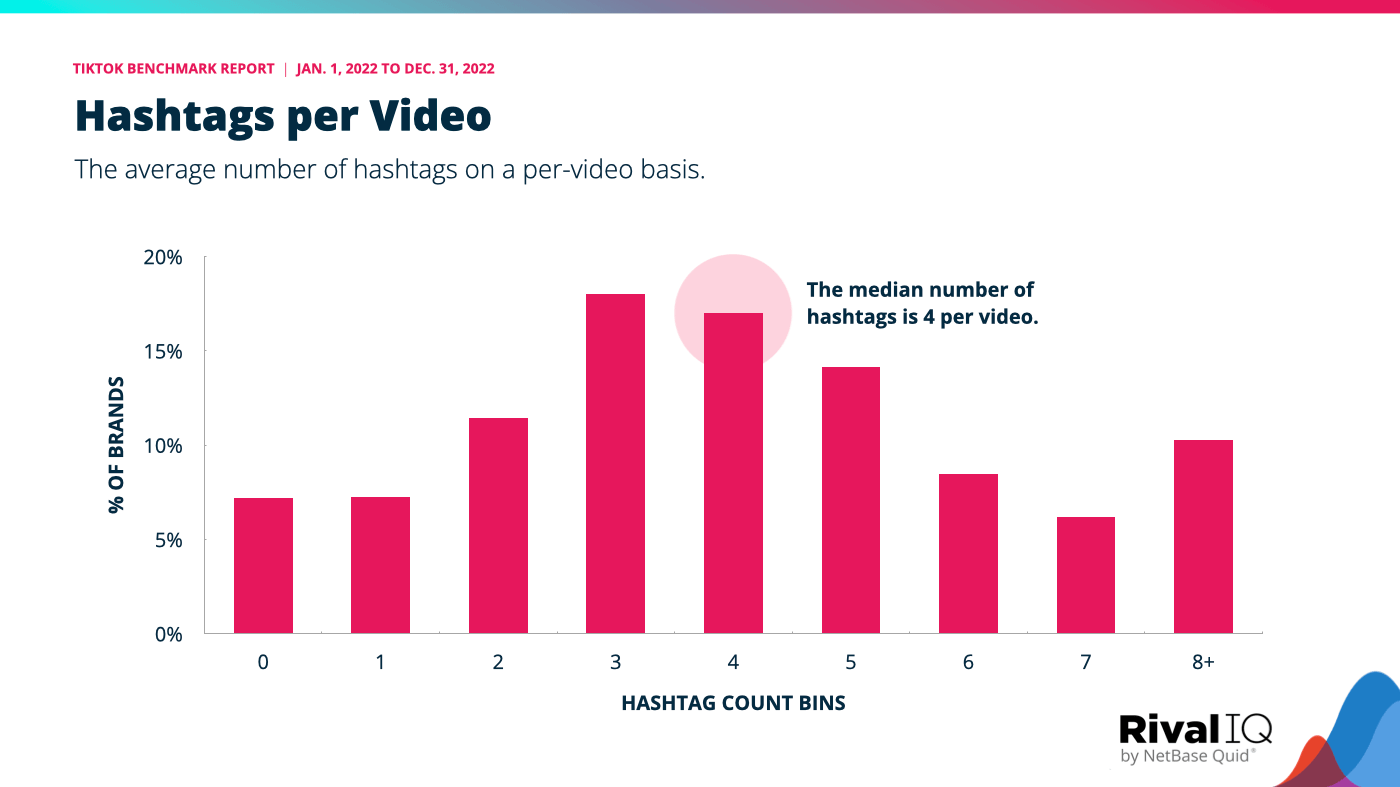
Hashtags are a powerful way to land content in the all-important #FYP, but more isn’t always better. Be sure to note your brand’s individual hashtag engagement to pick the right number of hashtags for your videos.
Videos with Mentions
Mentioning another handle in a video is a powerful way to amplify TikTok reach, whether it’s replying to a fan or trying to catch the attention of a favorite creator.
The average brand doesn’t mention other accounts very often, only in about 14% of their videos.
- About 11% of brands include a mention in more than half of their videos. Wow!
- Almost 9% of brands never mention another account.
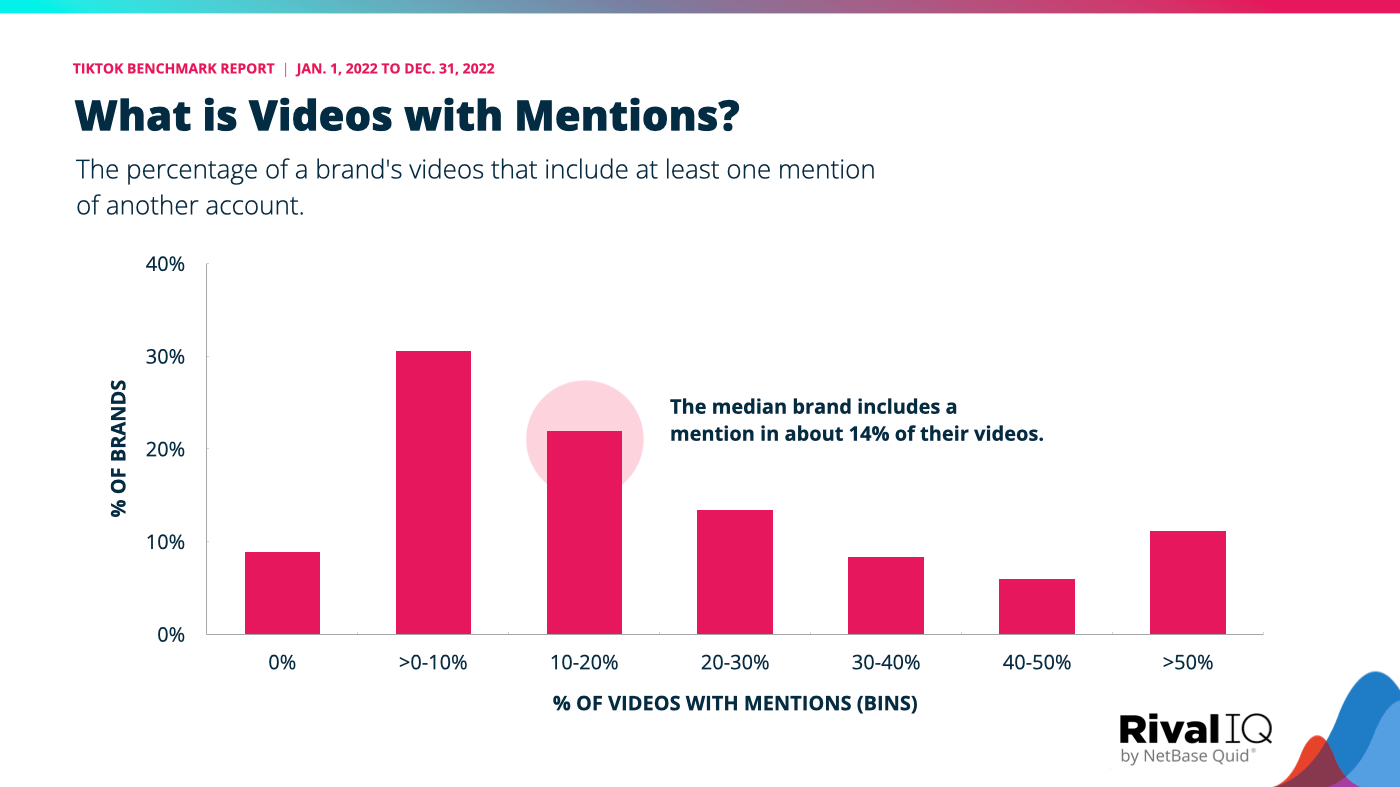
Mentions help non-followers find new videos that are related to brands and accounts they already love. These numbers suggest that brands are favoring original content over replies or mentions.
Brands that include mentions consistently in their videos tend to see higher per view engagement rates.
- Brands that use mentions in 10%-20% of their videos have the highest per-view engagement rates.
- Brands that never mention other accounts have the lowest per-view engagement rates at just 4.5%.
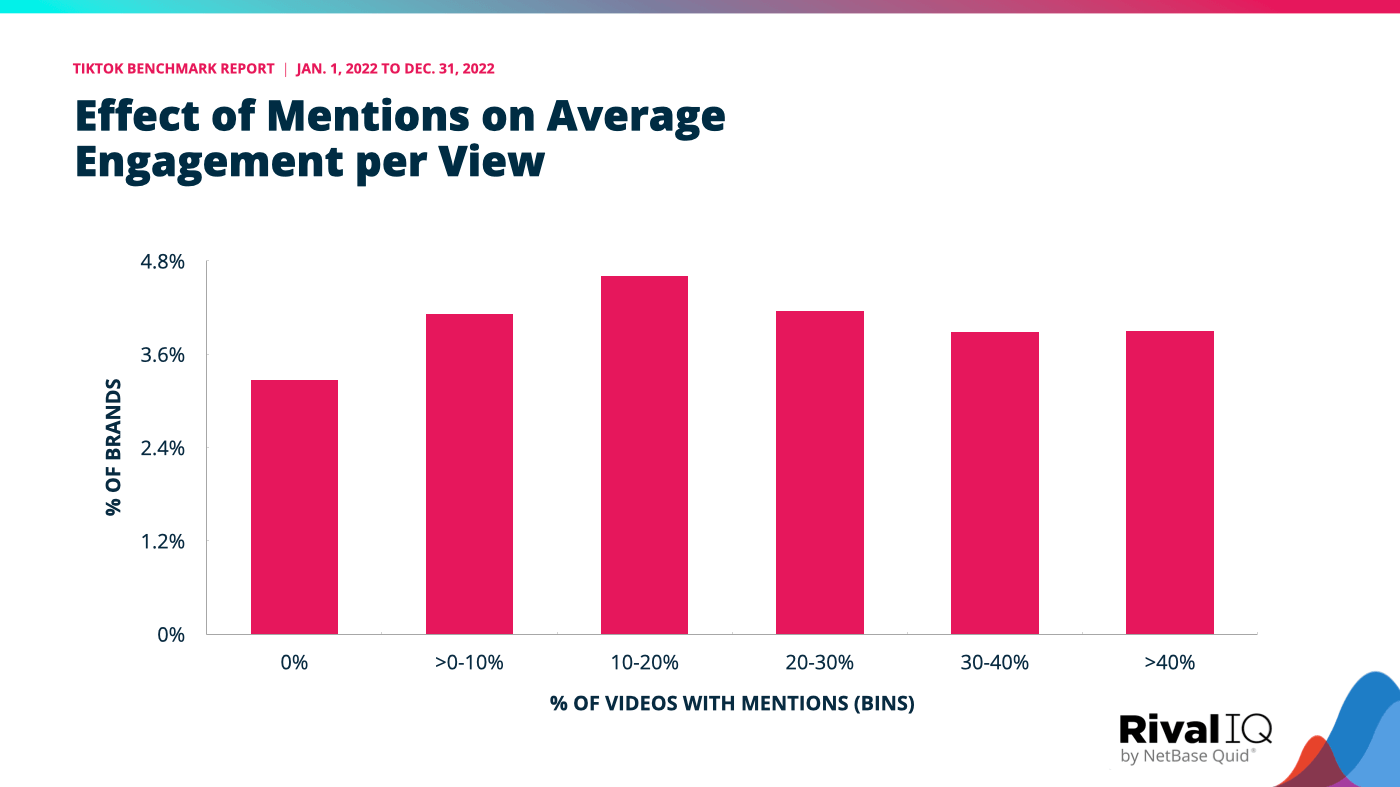
Don’t be afraid to start conversations with mentions on TikTok. These numbers show that aiming to include a mention every fifth video (or more frequently) will boost engagement while helping grow follower counts as more fans discover your brand.
Videos with Mentions Standout Performer: Amika
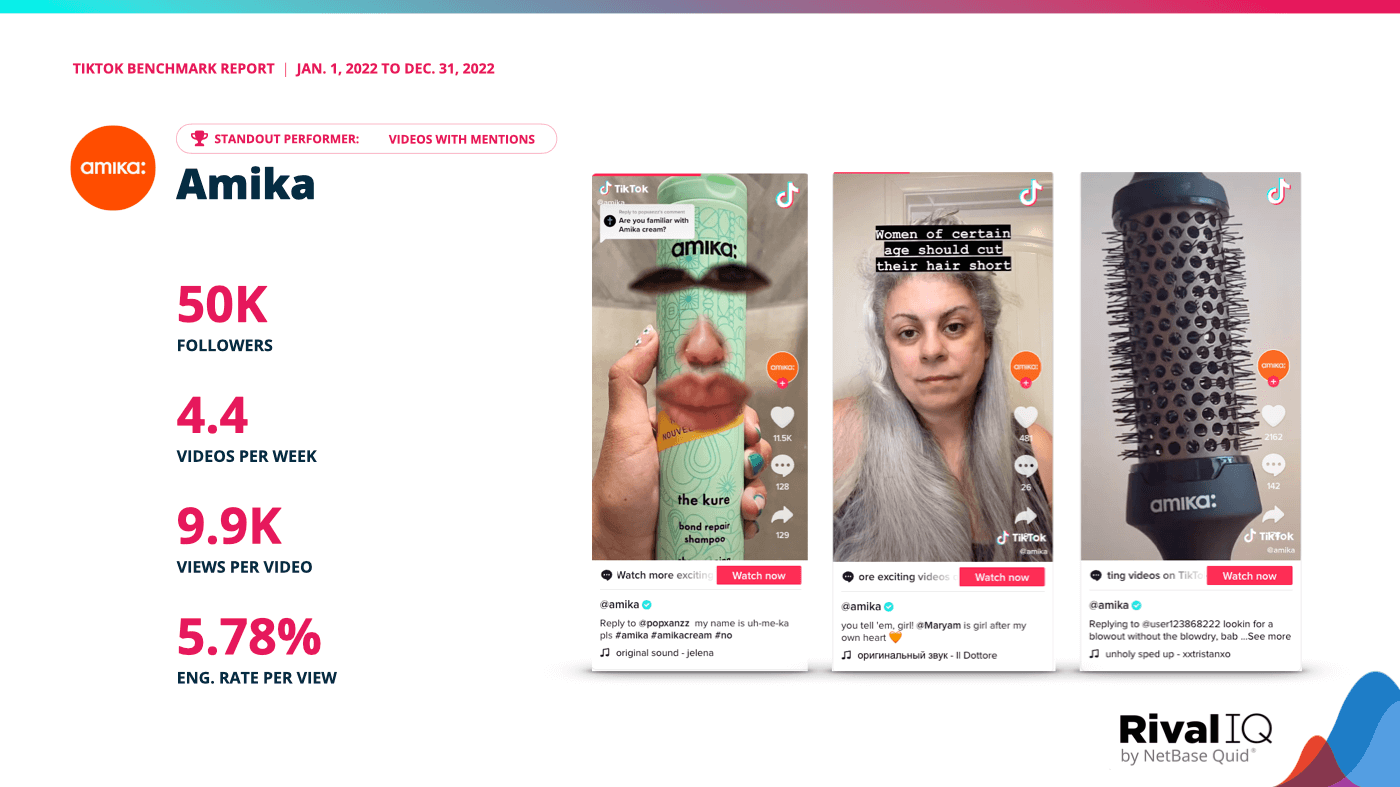
Health & Beauty brand Amika was all about mentioning other brands in more than half of their 200+ TikTok videos this year. From collabs with brands like Denman to replies to followers requesting help with their hair routine, Amika treated TikTok like the conversational platform it is to the delight of followers.
The hair brand wasn’t afraid to get sassy and silly in their TikToks, which kept followers engaged and coming back for more, while being genuinely helpful to fans looking to improve their hair routines was a time-consuming slam dunk for the brand.
Methodology
Rival IQ analyzed over 291K TikTok videos posted between January and December 2022 to bring you insights for your 2023 marketing strategy.
We included 2,000 handles that were active with posts in 2022 and a minimum of 1,000 followers. Handles were included only if we had all of their data for the entire time period, regardless of how frequently or infrequently they published TikTok videos. These handles reached across 14 different industries, including beauty, media, influencers, sports, higher education, and more.
TikTok Terms Glossary
We know there are many different ways to measure engagement, so here’s a quick round-up of all the TikTok engagement metrics we studied in this report and their definitions.
Engagement Rate by Follower: The average number of engagements per follower on a per-video basis.
Engagement Rate per View: The average number of engagements per view.
Engagement Total: The total number of interactions (likes, comments, and shares) on videos.
Hashtags per Video: The average number of hashtags on a per-video basis.
Monthly Follower Growth Rate: The average monthly growth rate over the report period.
Videos with Mentions: The percentage of a brand’s videos that include at least one mention of another account.
Videos per Week: The average number of videos a brand publishes per week.
Views per Follower: The average number of views per follower on a per-video basis.
Wrapping It Up
Congrats to all the brands we surveyed for killer engagement rates and constantly creating dynamic content on this tricky platform that definitely requires more investment than posting a link on Facebook or Twitter. We hope these TikTok benchmarks help you prove to your boss how awesome your brand is doing on TikTok (or at the very least, why you need a bigger budget to land your brand on more FYPs).