We’re thrilled to release the 2024 edition of our annual Social Media Industry Benchmark Report!
We’re featuring key social media benchmarks and metrics for 14 top industries: Alcohol, Fashion, Financial Services, Food & Beverage, Health & Beauty, Higher Education, Home Decor, Influencers, Media, Nonprofits, Retail, Sports Teams, Tech & Software, and Travel.
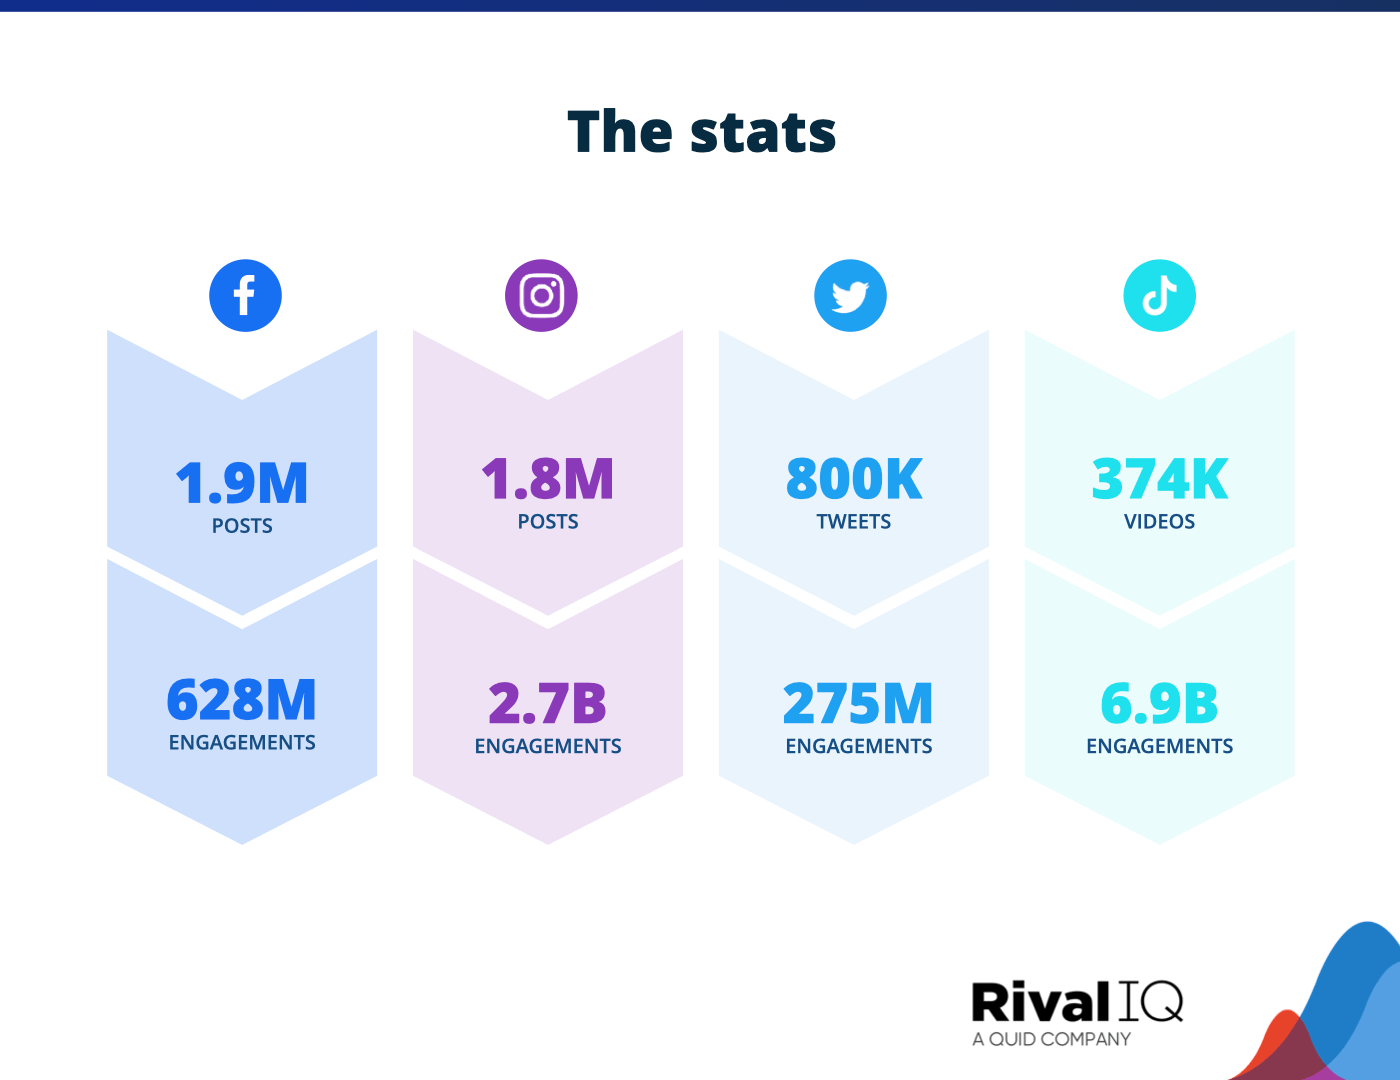
“How am I really doing on social?” can be a tricky question to answer without context from your competitors and industry. We looked at more than 5 million posts and 10 billion (yes, with a “b”) likes, comments, and favorites on Facebook, Instagram, TikTok, and Twitter from top brands in every major industry to bring you the freshest social media benchmark data for posting frequency, post types, hashtags, and more.
Now, let’s get benchmarking!
Social Media Benchmark Key Takeaways
| Brands saw (a little) less organic engagement this year TikTok engagement rates dropped by about 50% this year, but Facebook engagement rates actually increased a little, so it’s not all bad. |
|
| Posting frequency varied Post frequency increased a little on Instagram and TikTok while decreasing on Facebook and Twitter. |
|
| It’s all about the holiday hashtags Once, again, almost every industry earned top engagement rates from holiday-hashtagged posts. |
|
| Reels overtook video on Instagram If you’re not posting Reels, you’re officially missing out on the most engaging post type by rate on the ‘gram. |
|
| TikTok is (still) topping the charts With a median engagement rate of 2.63%, TikTok still performed better than any other channel by a mile this year. |
|
| Higher Ed and Sports Teams are still the industries to beat These industries outperformed their competitors thanks to a smart combo of quality content and frequent posting. |
Grab the full 2024 Benchmark Report
Download the report nowAll-Industry Social Media Benchmarks
All-Industry: Facebook
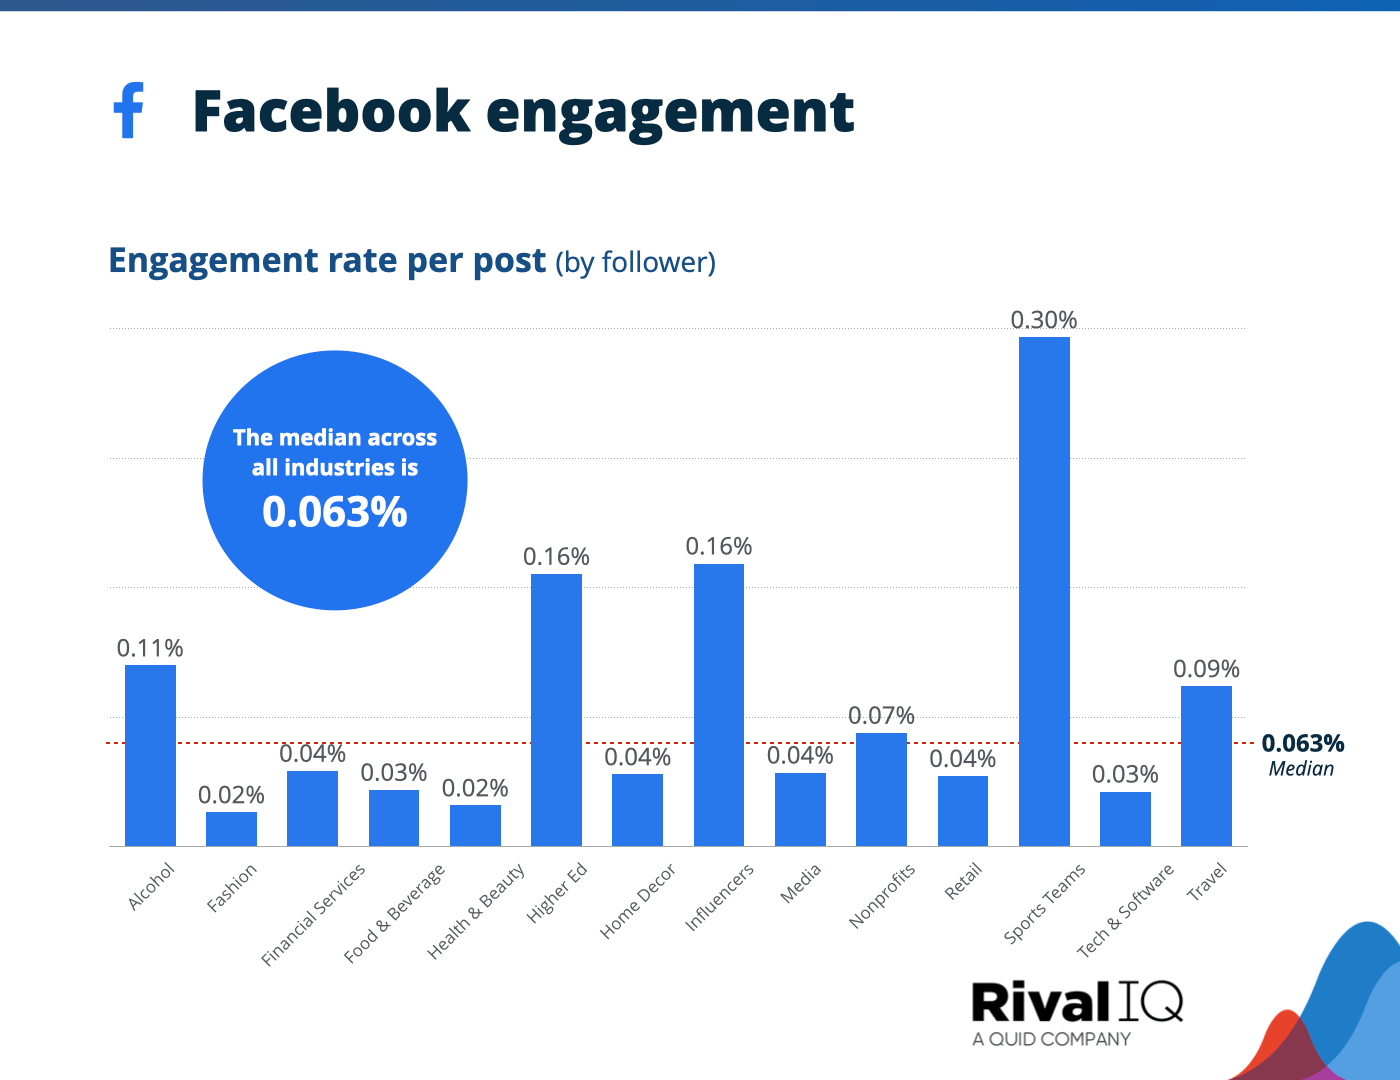
Average Facebook engagement rate per post, all industries
Everyone loves an increase: the all-industry median rose, as did engagement rates for industries including Alcohol, Higher Ed, and Sports Teams.
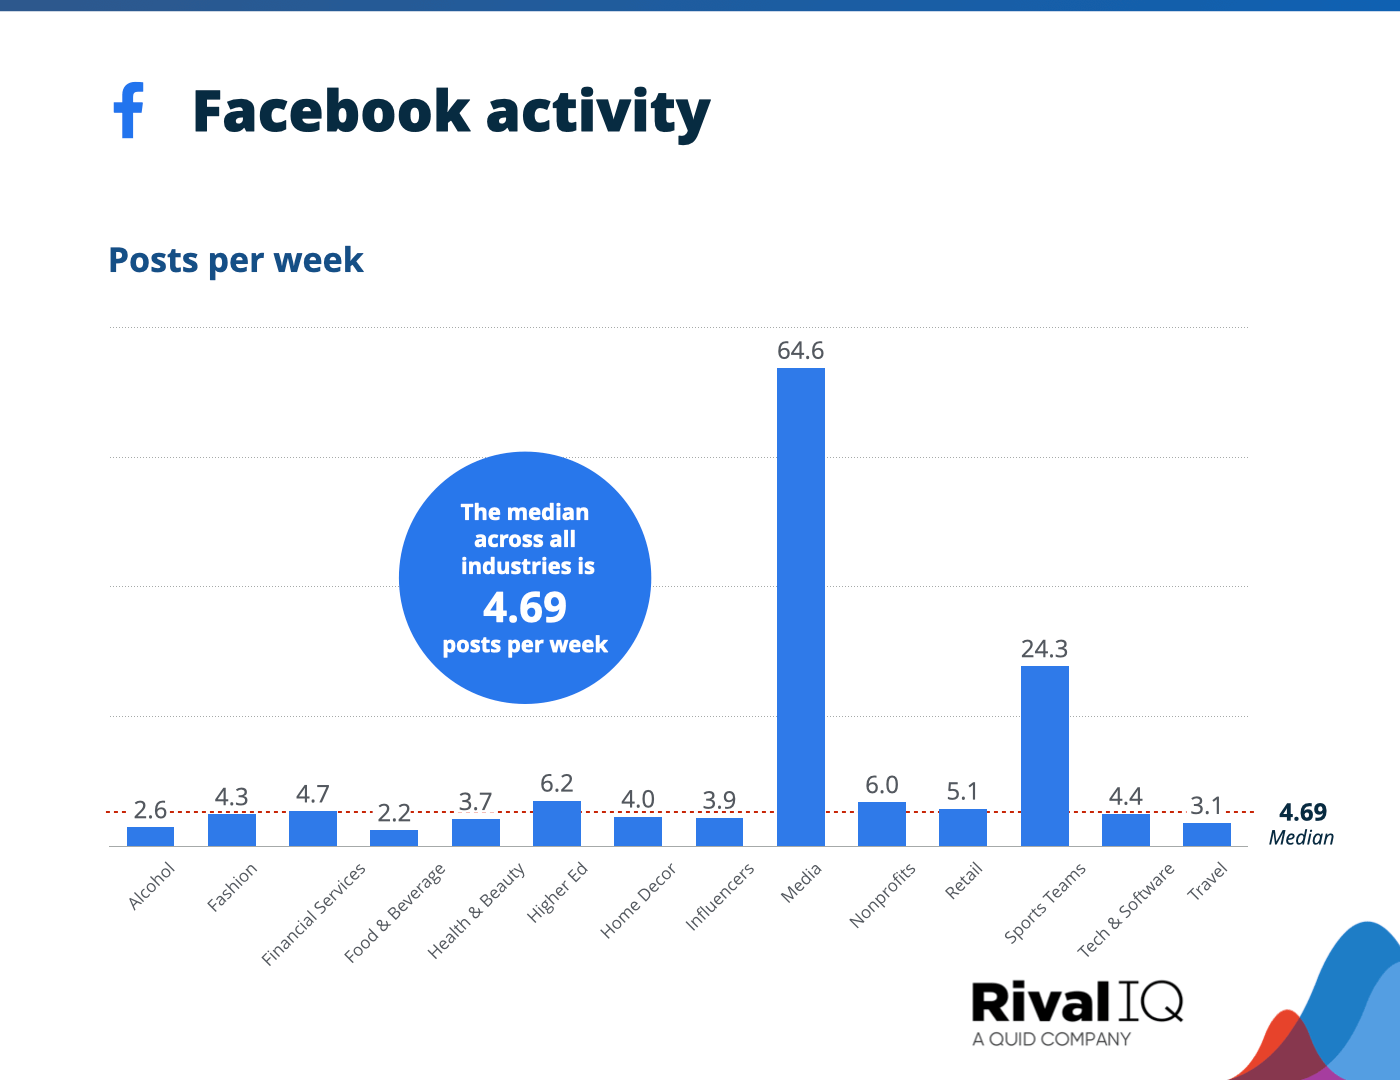
Average Facebook posts per week, all industries
Brands posted just a little less often on Facebook this year overall, but Fashion, Financial Services, Food & Beverage, Home Decor, and Sports Teams actually increased their activity.
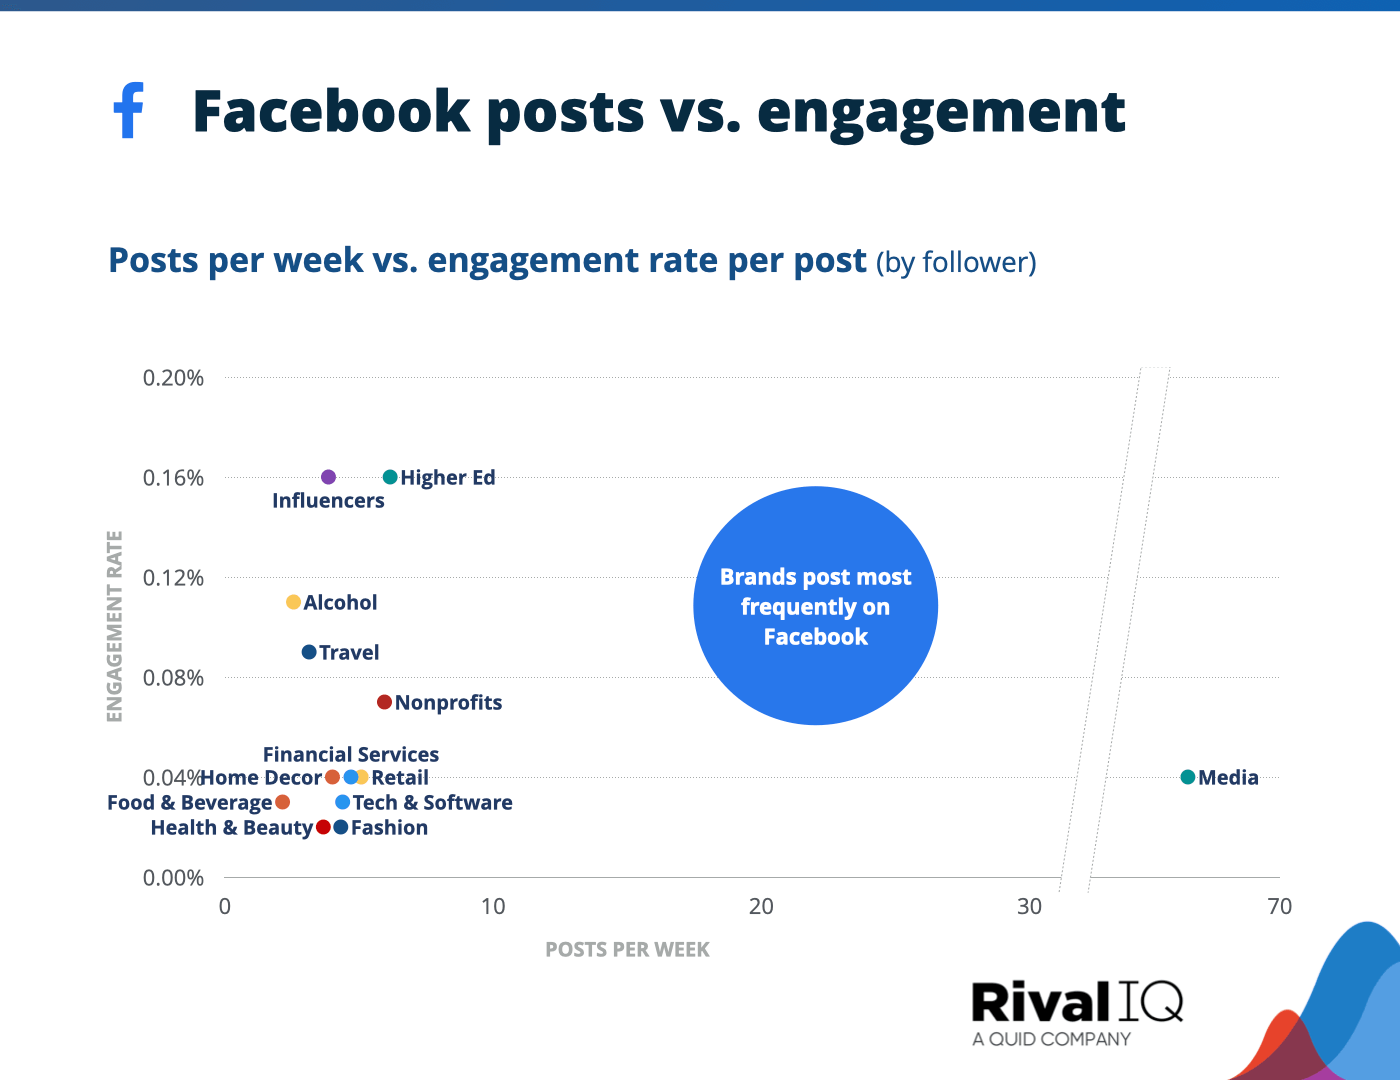
Facebook posts per week vs. engagement rate per posts, all industries
Influencers and Higher Ed hit the sweet spot of moderate posting frequency with epic engagement rates.
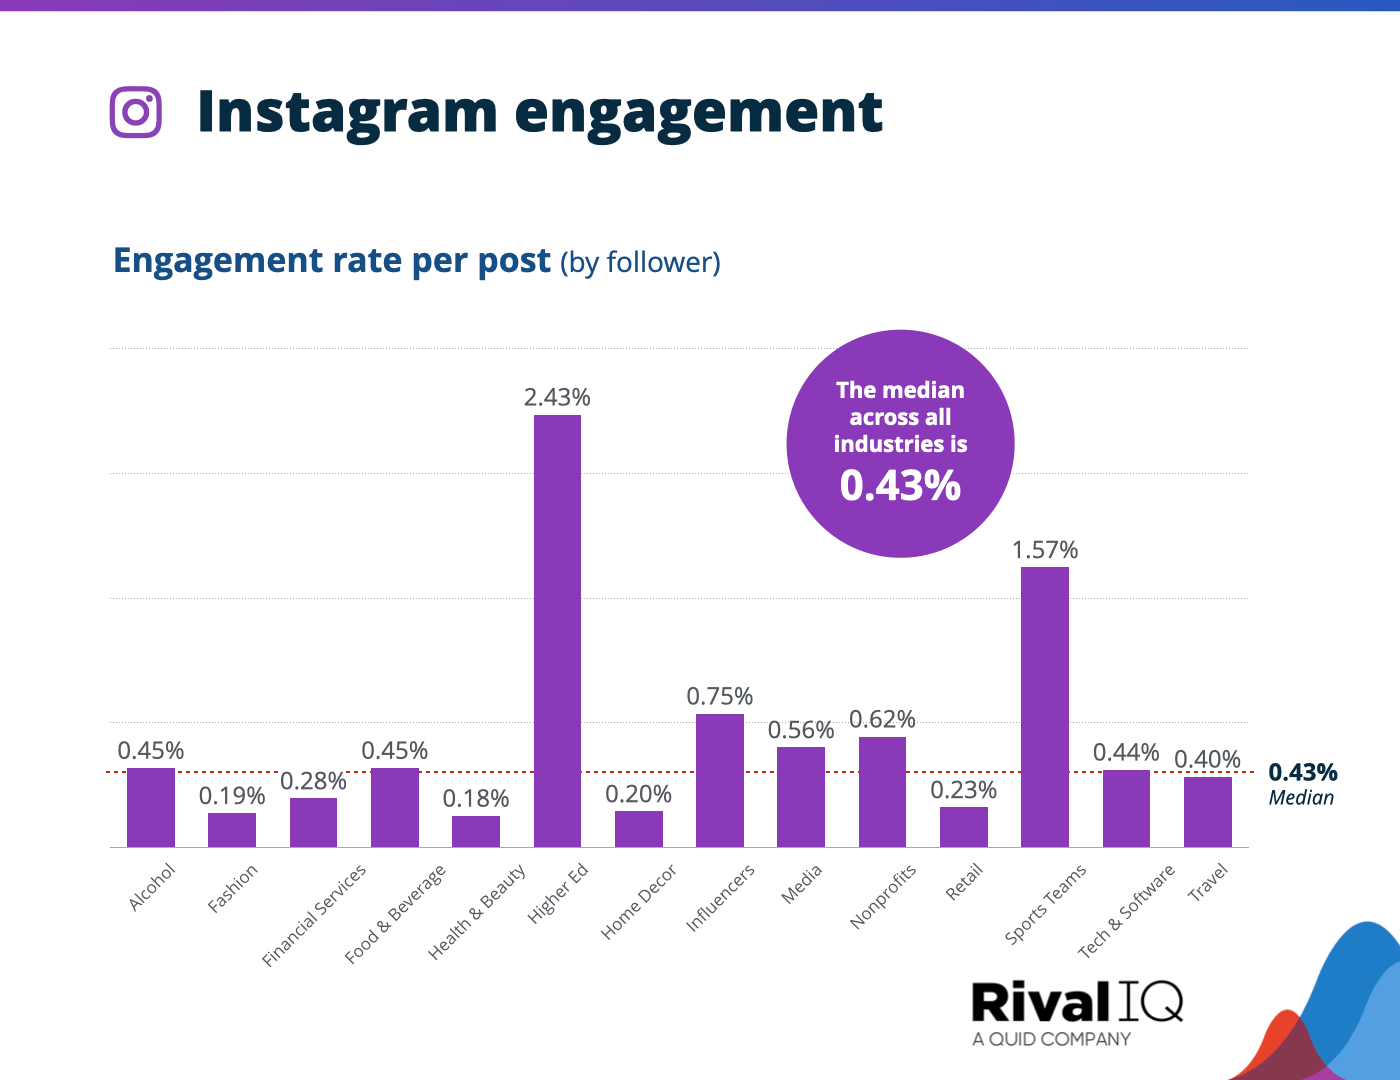
Average Instagram engagement rate per post, all industries
Instagram engagement rates stayed pretty flat this year with just an 8% decline.
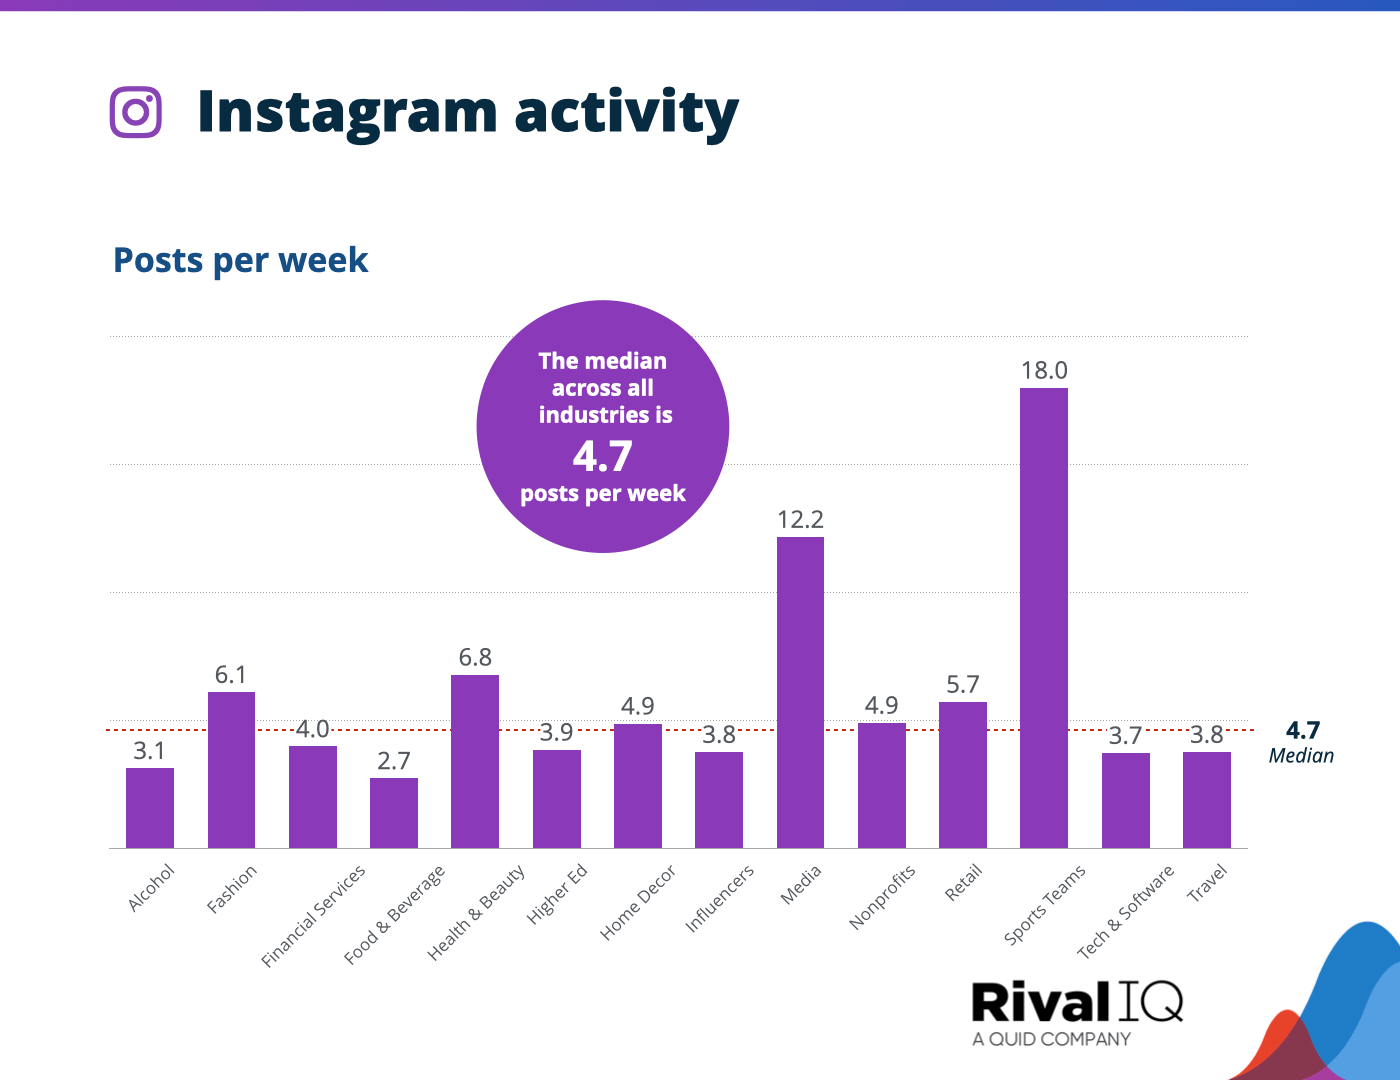
Average Instagram posts per week, all industries
For the second year in a row, median posting frequency across all industries increased by a hair on Instagram.
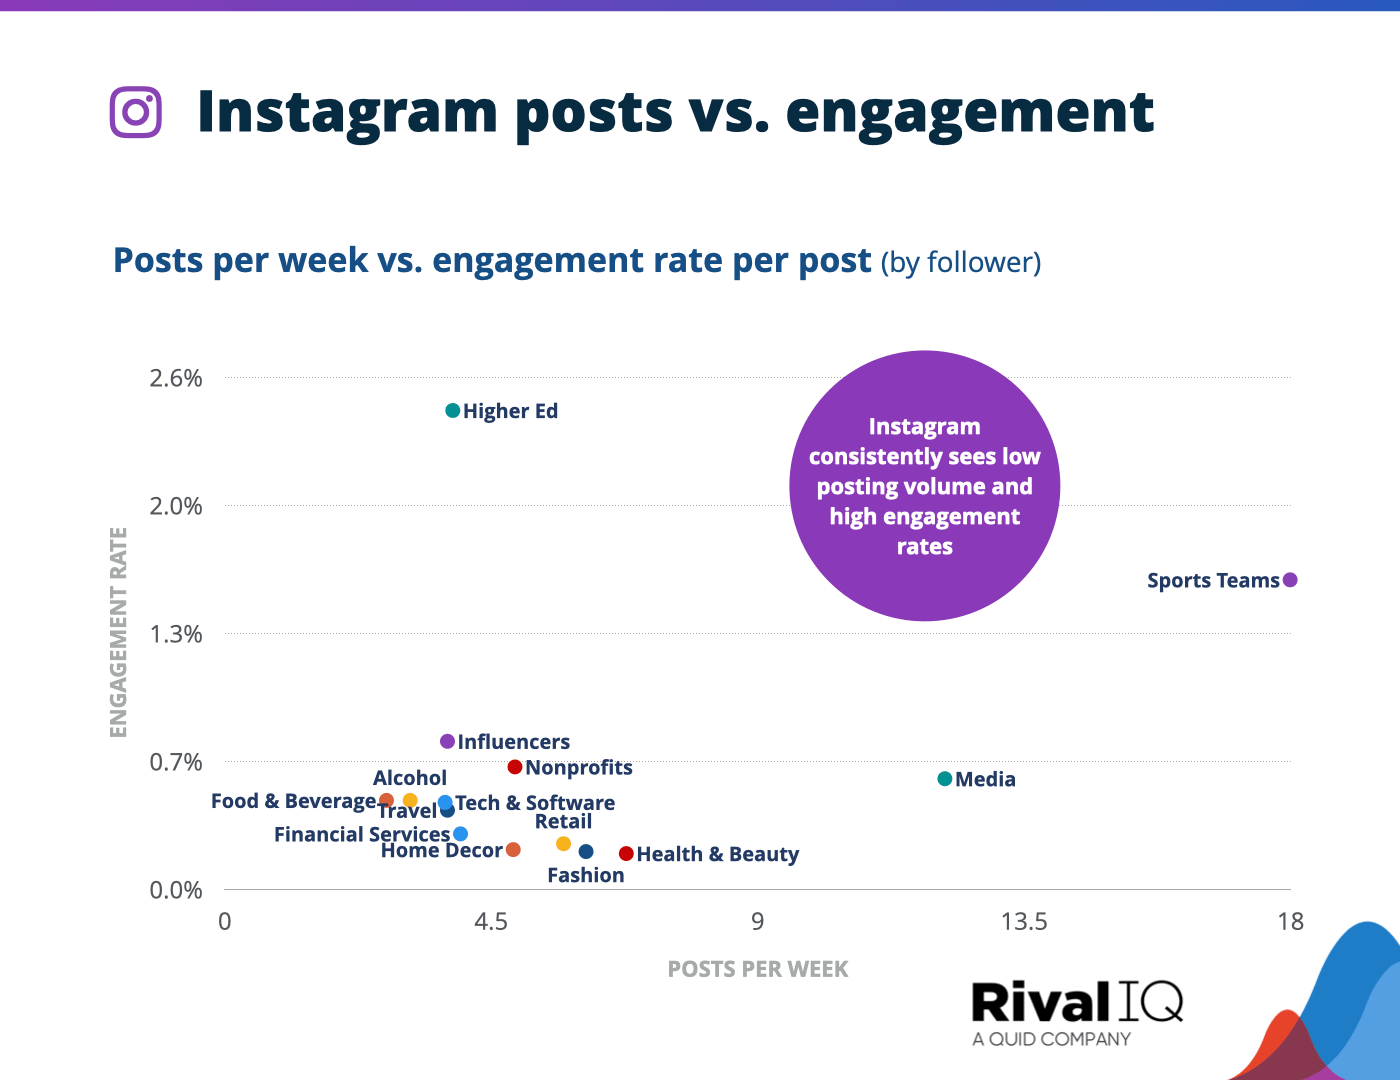
Instagram posts per week vs. engagement rate per posts, all industries
Higher Ed was the clear engagement winner on Instagram despite below-median posting frequency, suggesting more isn’t always better on Instagram (though second-place Sports Teams might beg to differ).
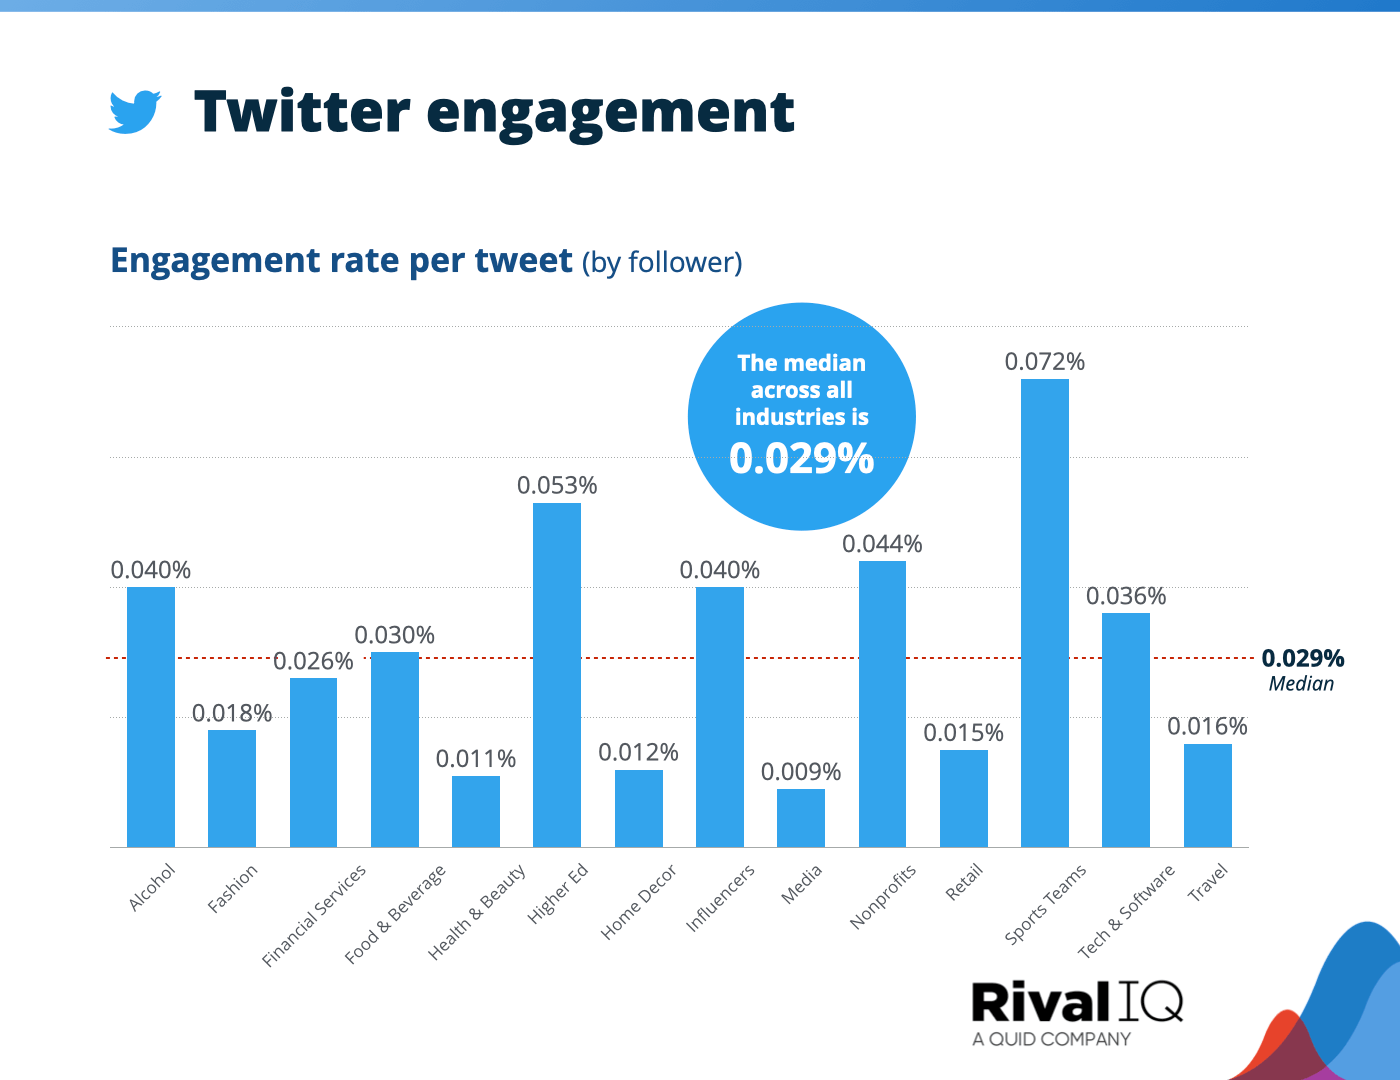
Average Twitter engagement rate per tweet, all industries
Engagement rates declined about 20% on Twitter this year, which is no surprise in a time of big upheaval for the channel.
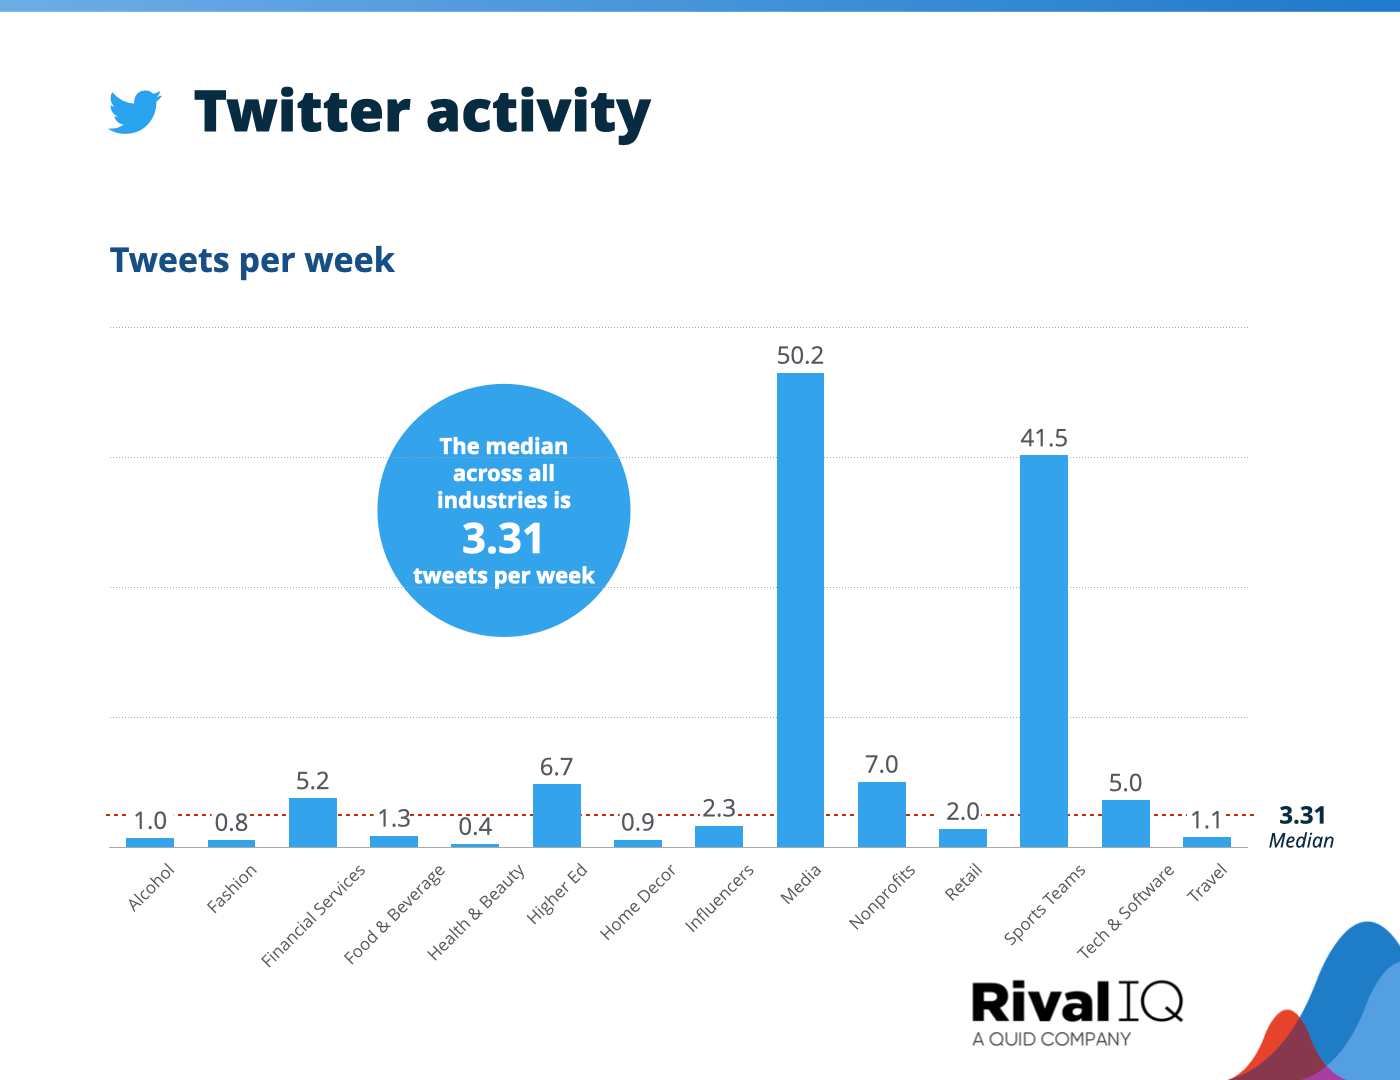
Average Twitter tweets per week, all industries
Tweet frequency decreased by about 15% this year across all industries as brands pulled back their efforts in response to the channel’s volatility.
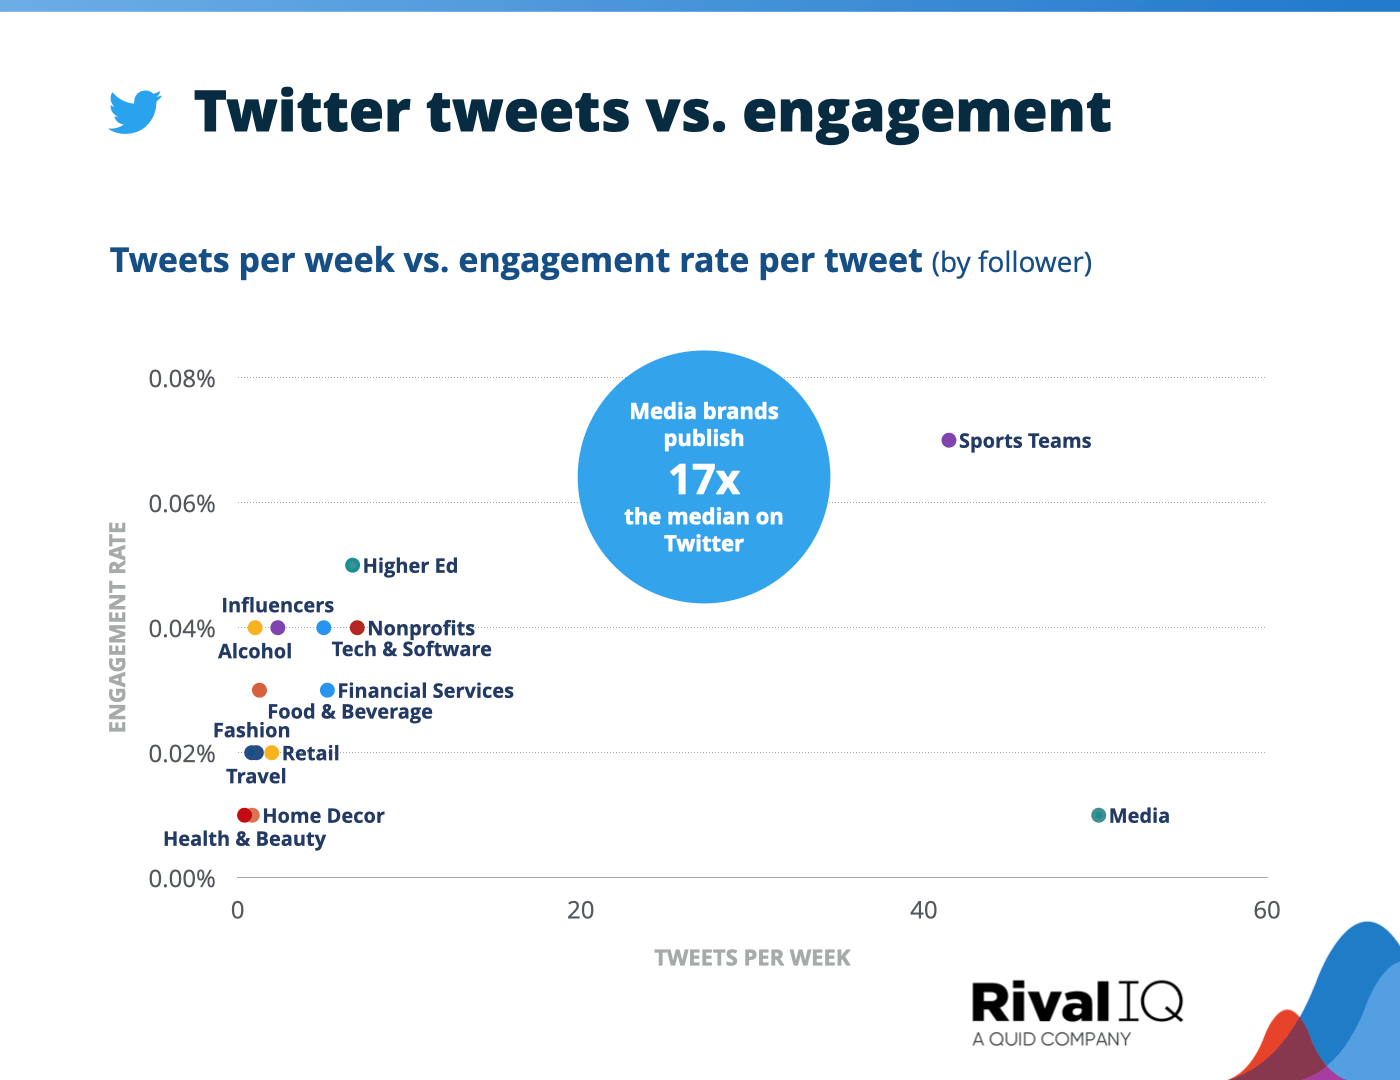
Twitter tweets per week vs. engagement rate per posts, all industries
Frequent tweeters Higher Ed and Sports Teams came out ahead on Twitter this year, but last-place Media showed other industries that tweeting more doesn’t always result in high engagement.
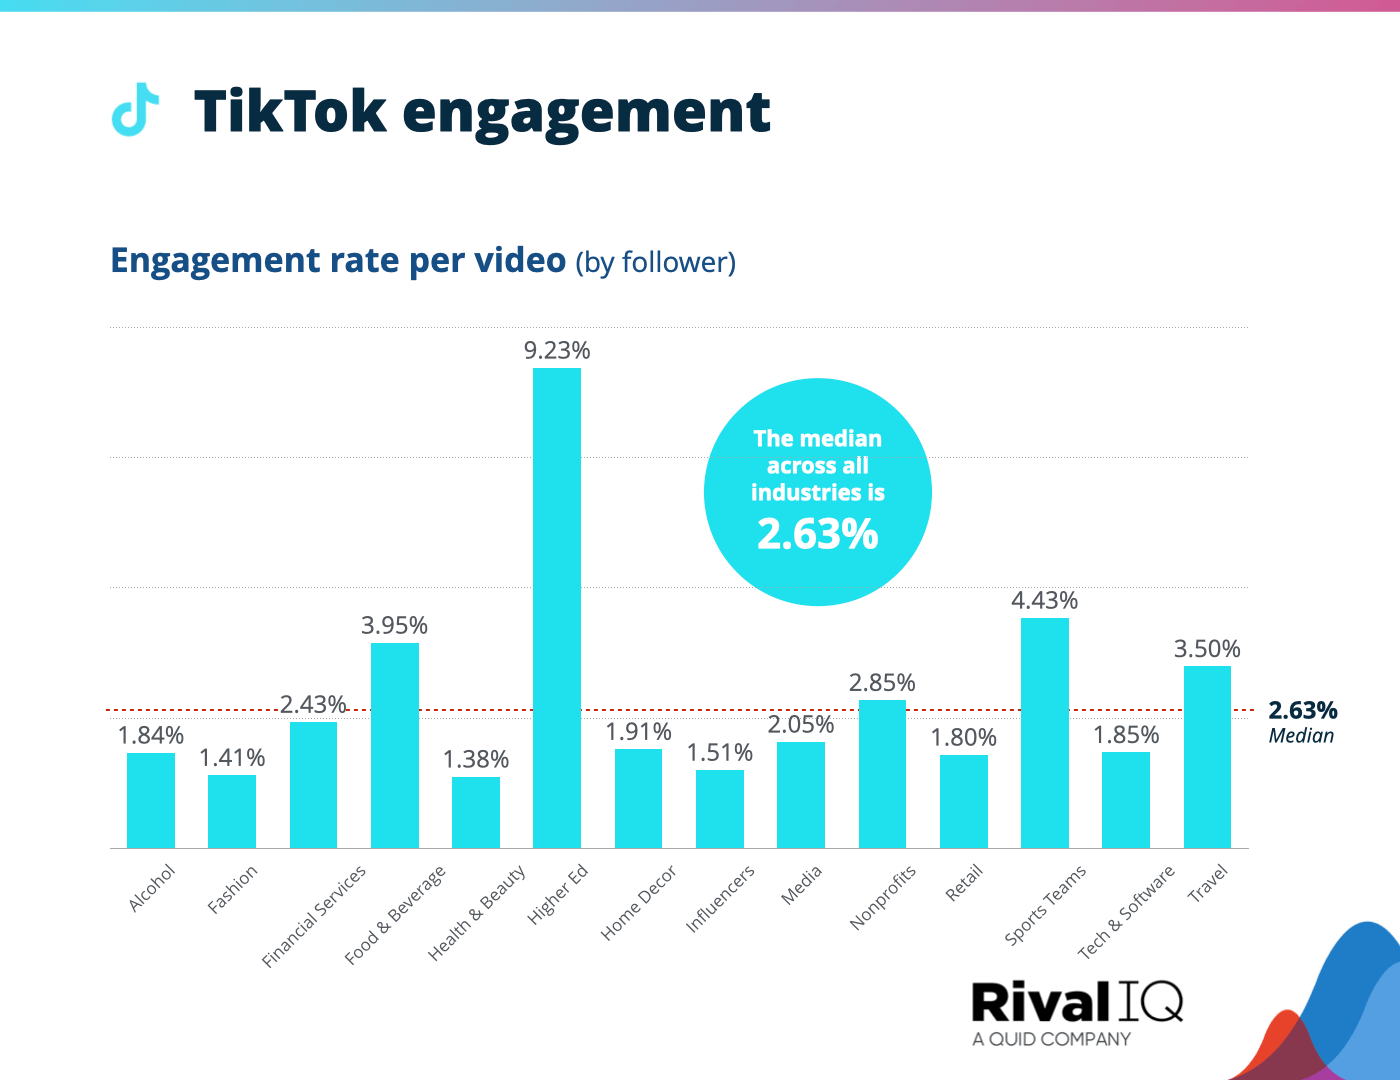
Average TikTok engagement rate per video, all industries
The bad news: TikTok engagement rates dropped more than 50% on average this year. The good news: engagement rates on this channel stayed light years ahead of other social platforms.
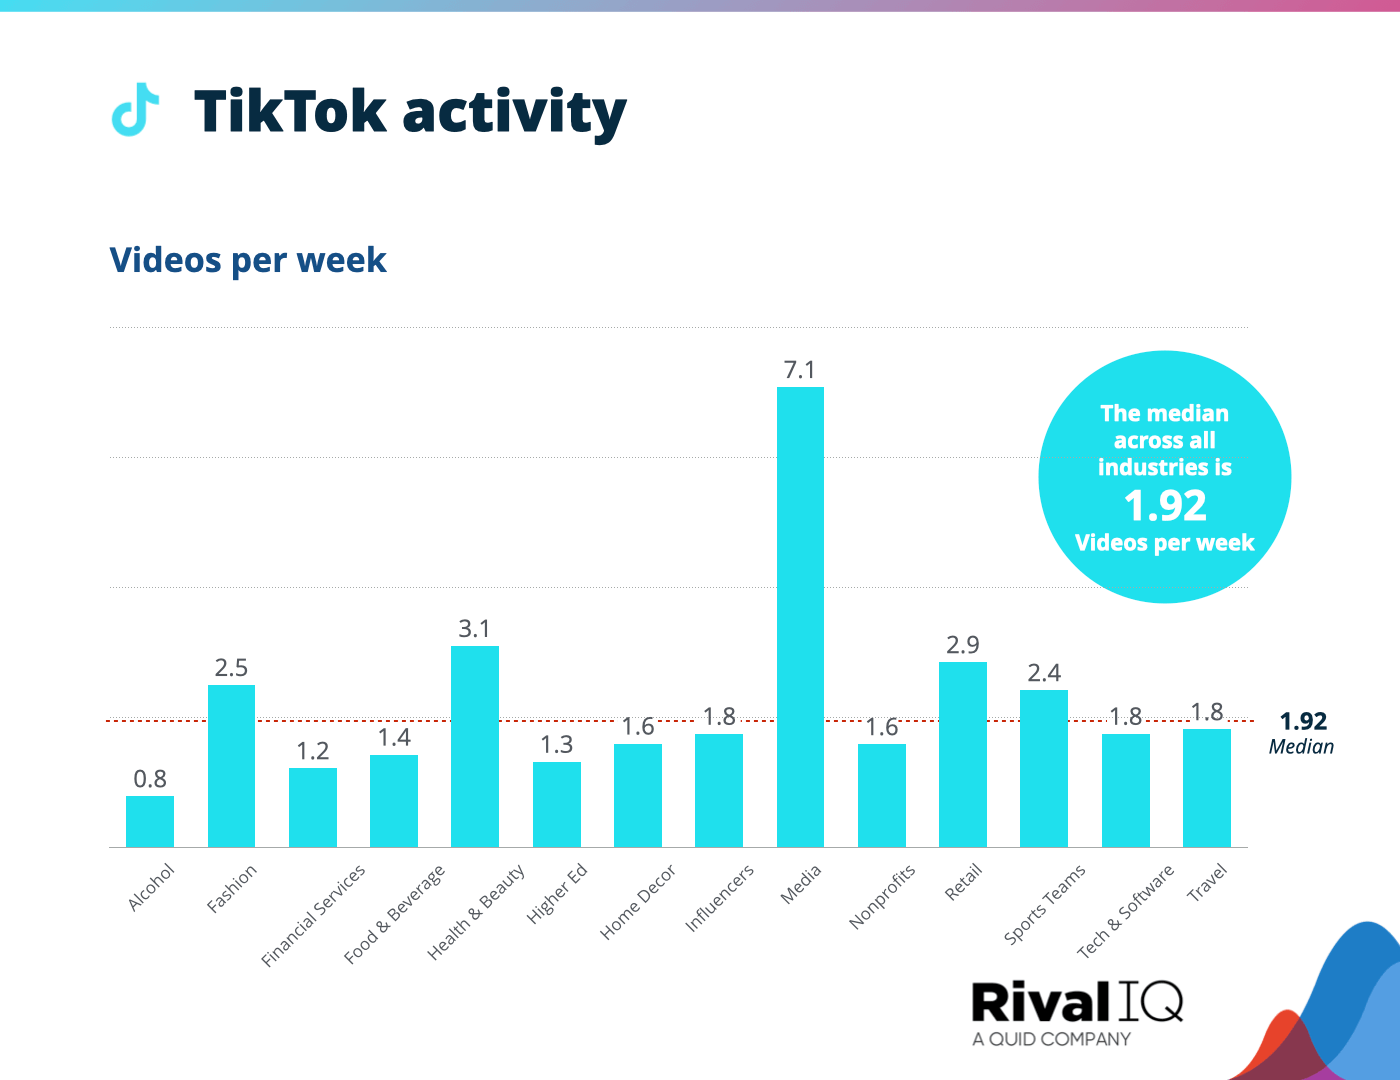
Average TikTok videos per week, all industries
Brands posted more frequently on TikTok than they did last year across the board. Media brands seriously invested in this channel, posting nearly twice as often as they did in the previous period.
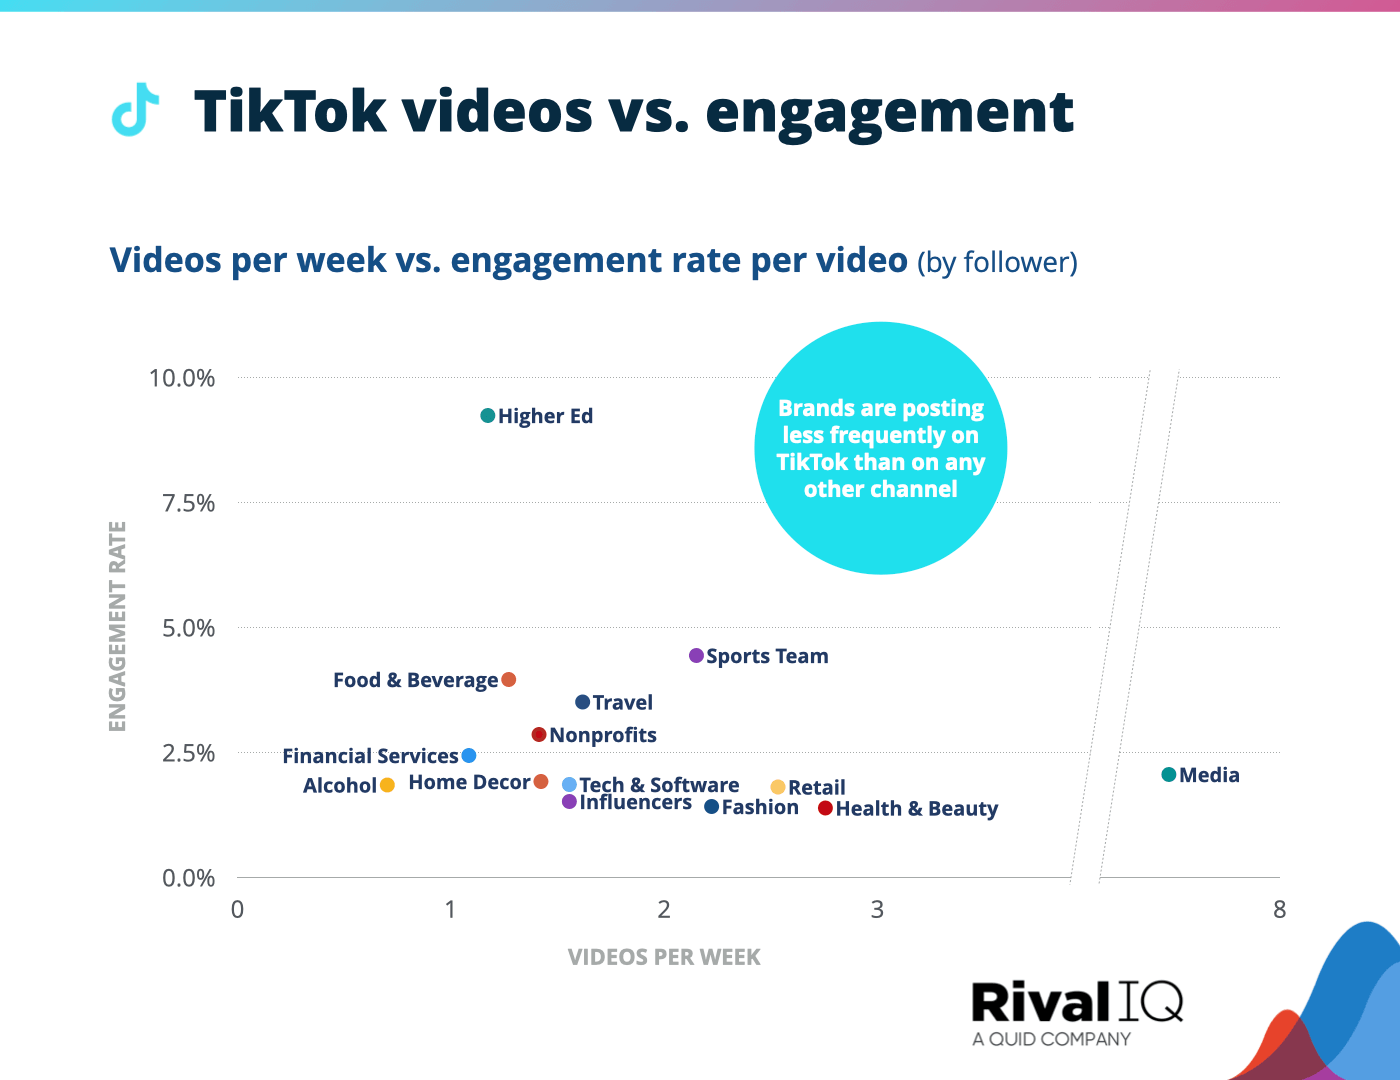
TikTok posts per week vs. engagement rate per posts, all industries
Higher Ed dramatically outstripped the competition with high engagement rates and modest posting activity on TikTok, with second place Sports Teams earning nearly half the engagement these colleges and universities snagged.
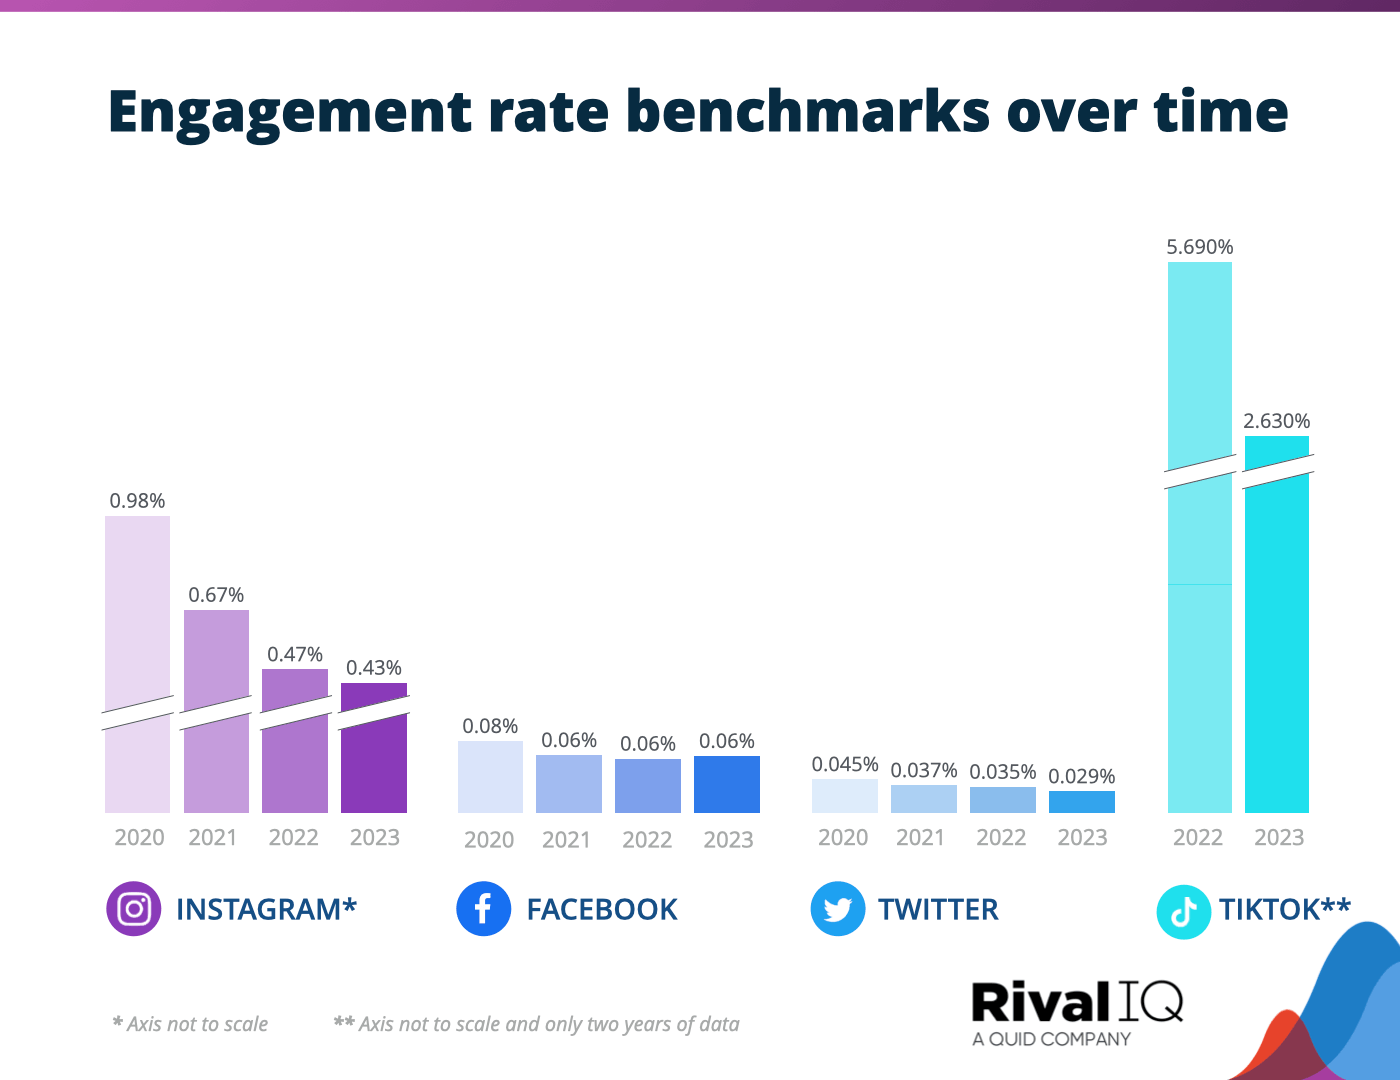
Engagement rate benchmarks vs time, all industries
Even though TikTok accounts earned about half the engagement rates they did last year, the video channel continues to outpace Instagram, Facebook, and Twitter by miles.
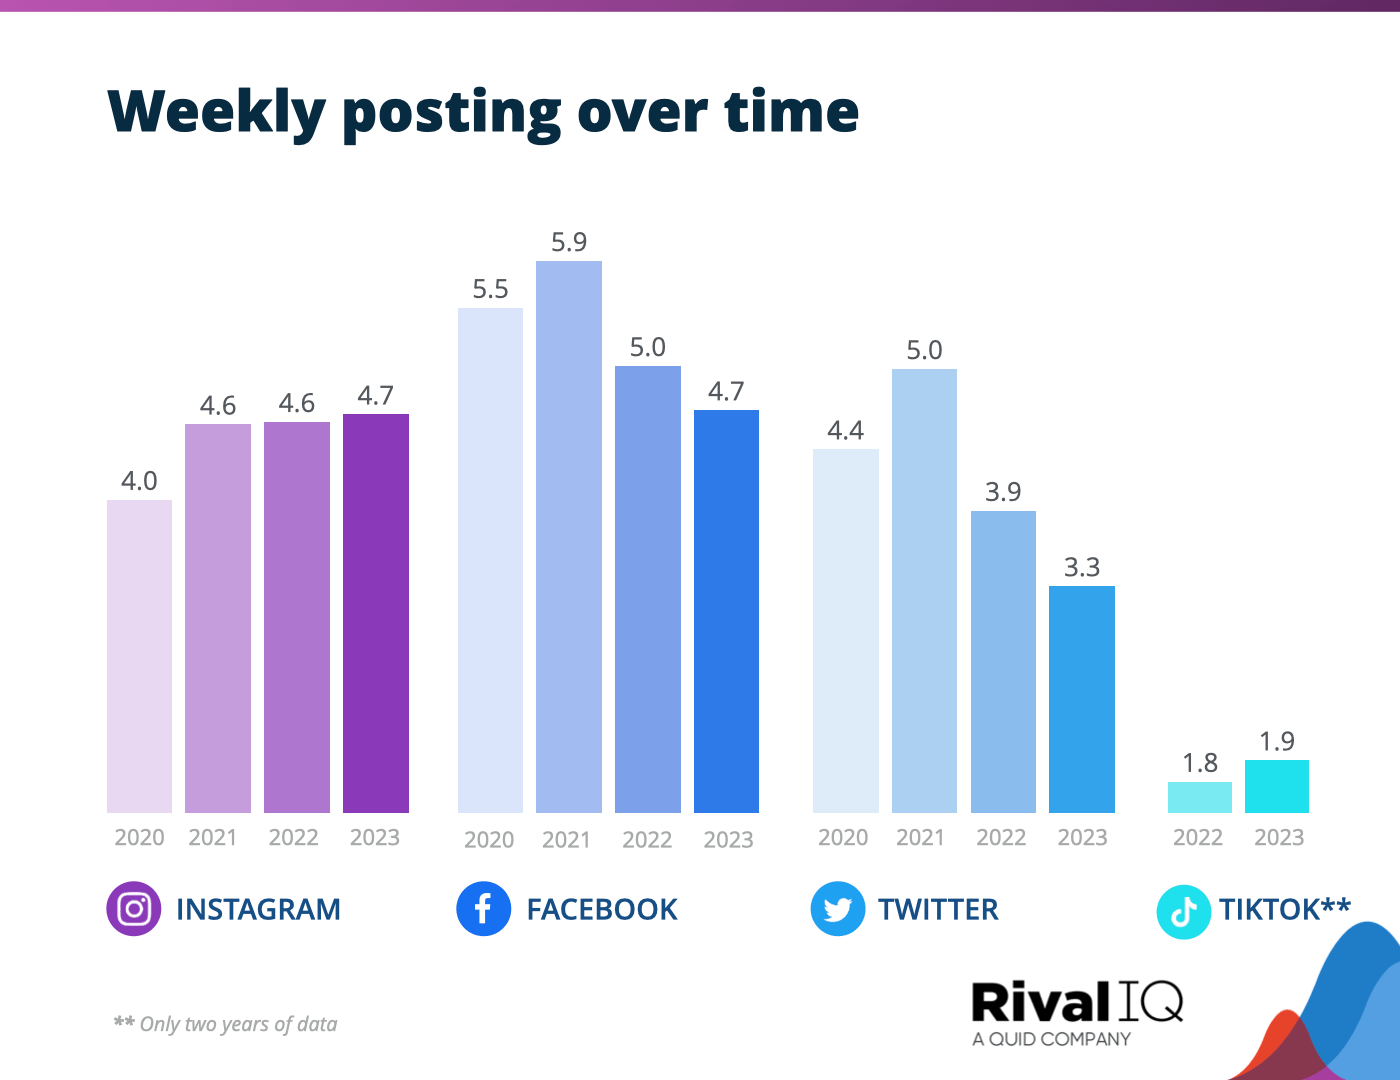
Posting frequency benchmarks vs time, all industries
Post frequency increased just a bit on Instagram and TikTok this year while slowing down on Facebook and Twitter.
Twitter posting took the sharpest dive at 15%, suggesting people aren’t as invested in X as they once were.
Alcohol Social Media Benchmarks
Alcohol brands earned above-median engagement rates everywhere but TikTok this year, where age restricted-content continued to keep them down. Fourth on Facebook and third on Twitter is still worth raising a glass, though.
A few ways Alcohol brands can keep up the pace:
- Try experimenting with posting frequency, since Alcohol brands consistently post less frequently than other industries.
- Alcohol brands’ best bets for hashtags are all about booze and holidays to help followers figure out what they’re drinking and when.
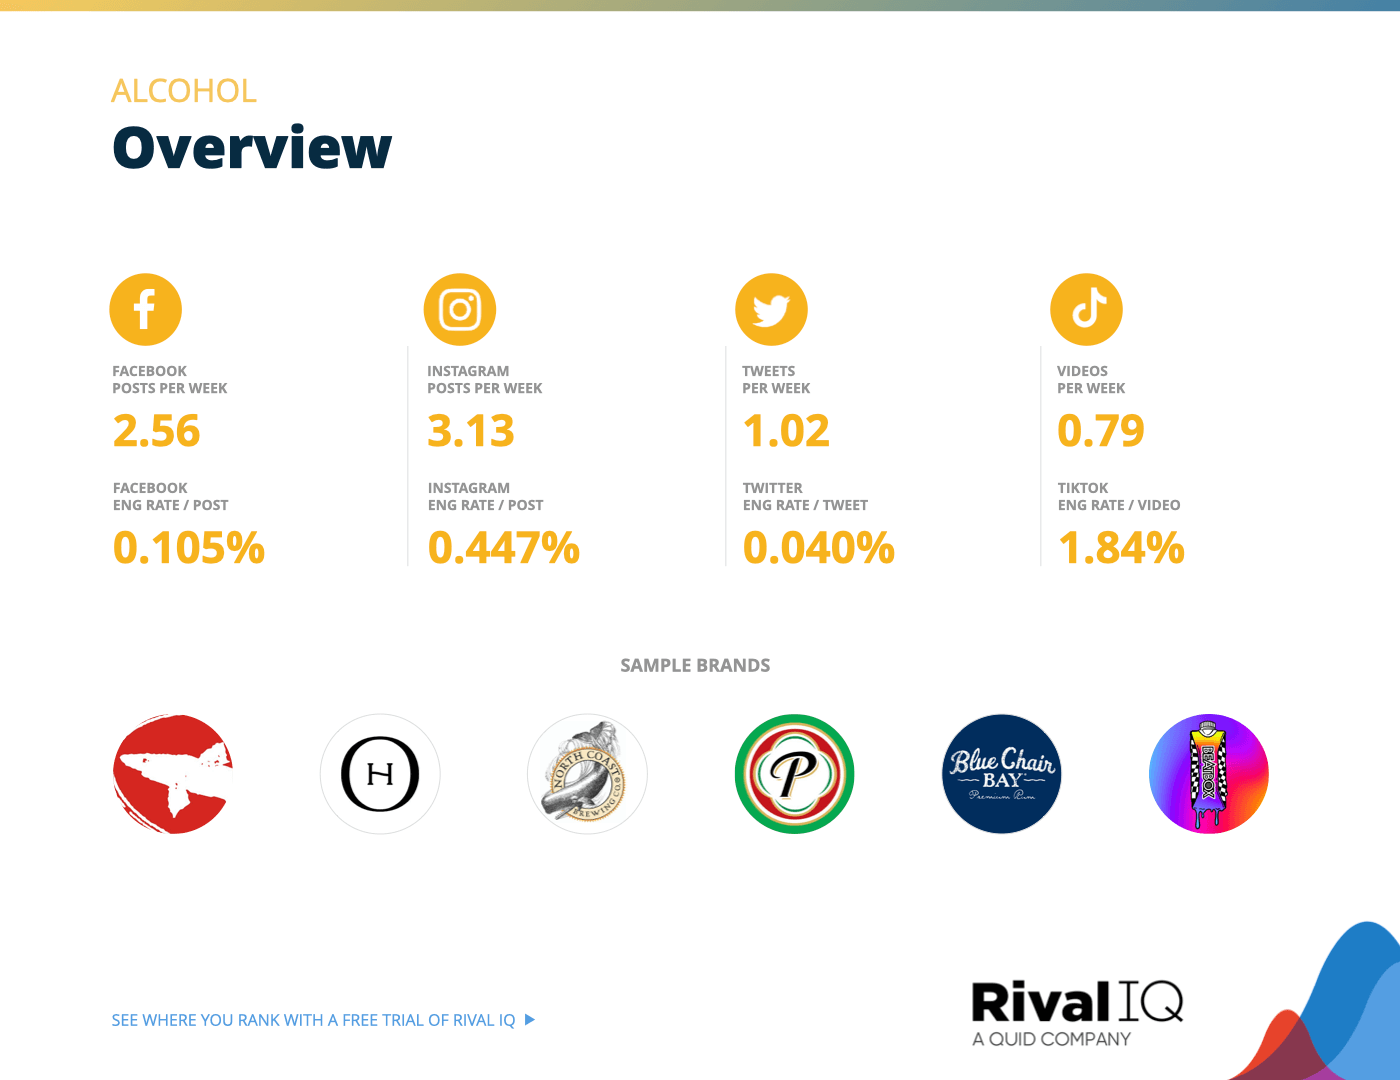
Overview of all benchmarks, Alcohol
Notable brands in this year’s report include Beatbox Beverages, Blue Chair Bay Rum, Dogfish Head Brewery, North Coast Brewing Company, One Hope Wine, and Presidente Brandy.
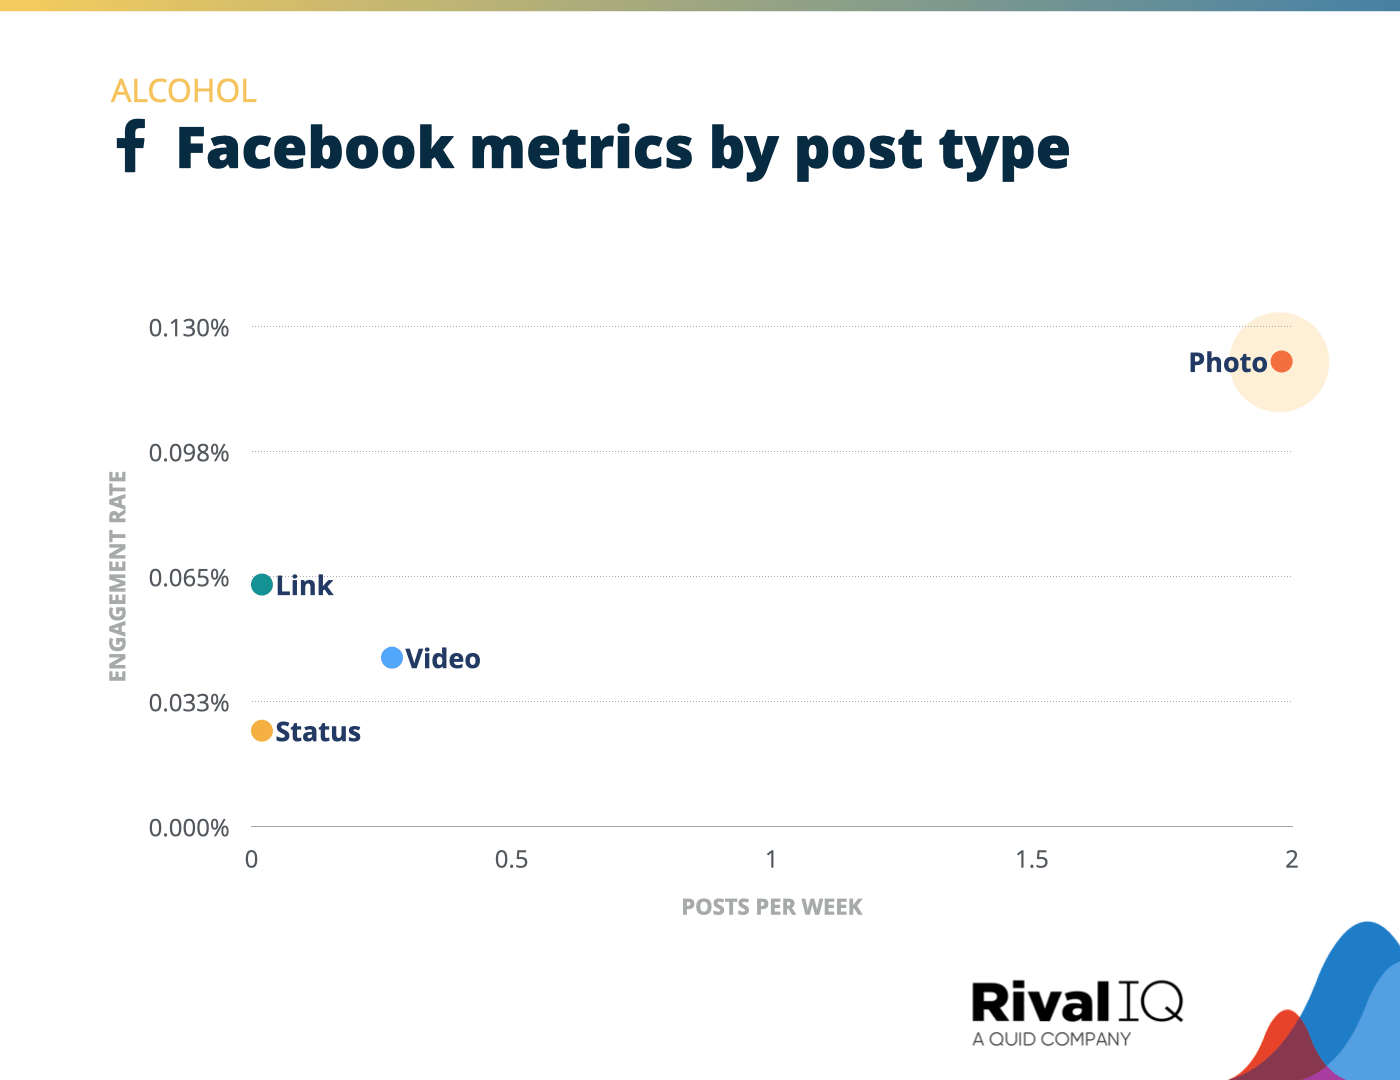
Facebook posts per week and engagement rate by post type, Alcohol
Alcohol brands have relied on photo posts year after year for their epic engagement oomph, and this year is no exception.
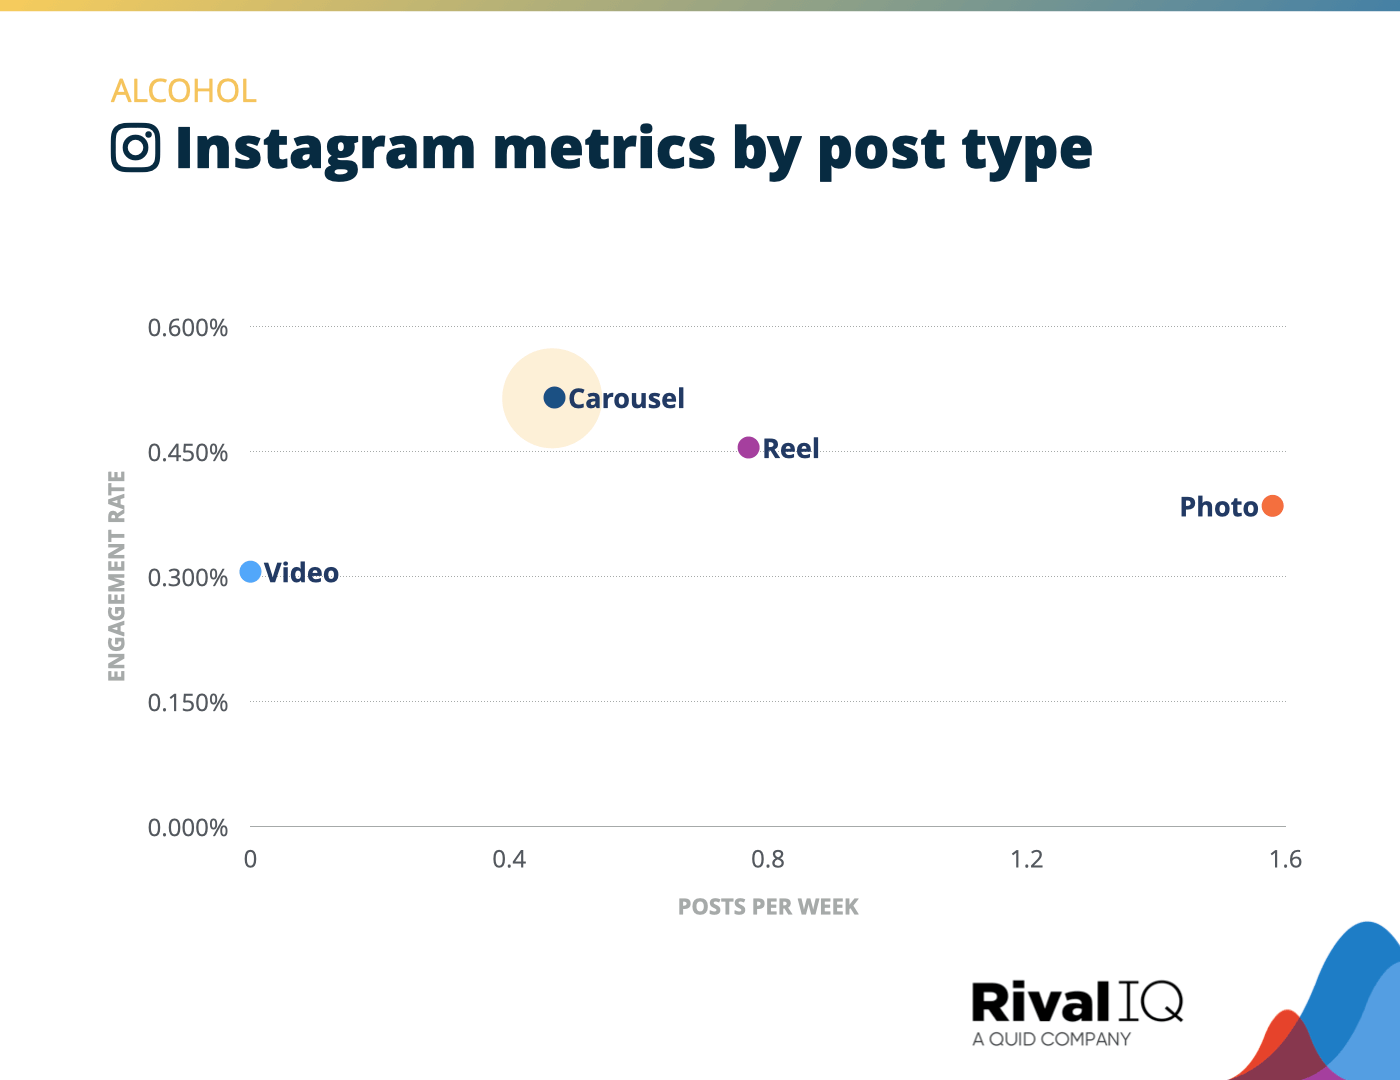
Instagram posts per week and engagement rate by post type, Alcohol
Carousels grabbed the highest engagement rates for Alcohol brands, who were much likelier to post photos on Instagram. Consider combining a few of those single-photo posts into high-performing carousels.
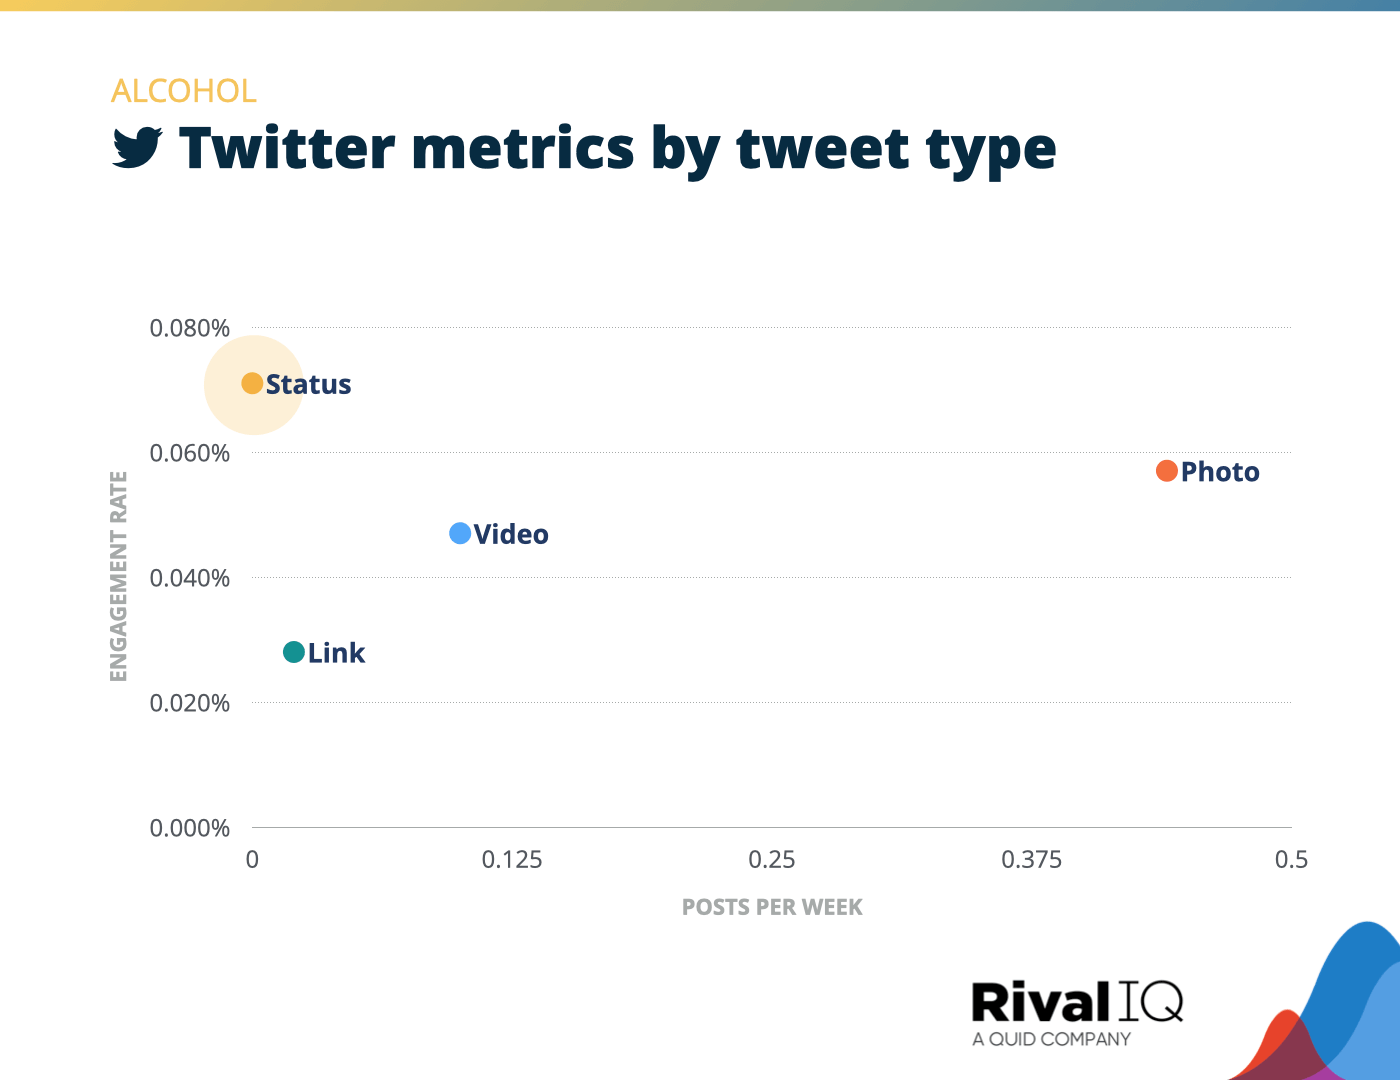
Twitter posts per week and engagement rate by tweet type, Alcohol
Status tweets were a surprise hit for Alcohol brands this year on Twitter, but photo tweets were also a tried and true source of engagement.
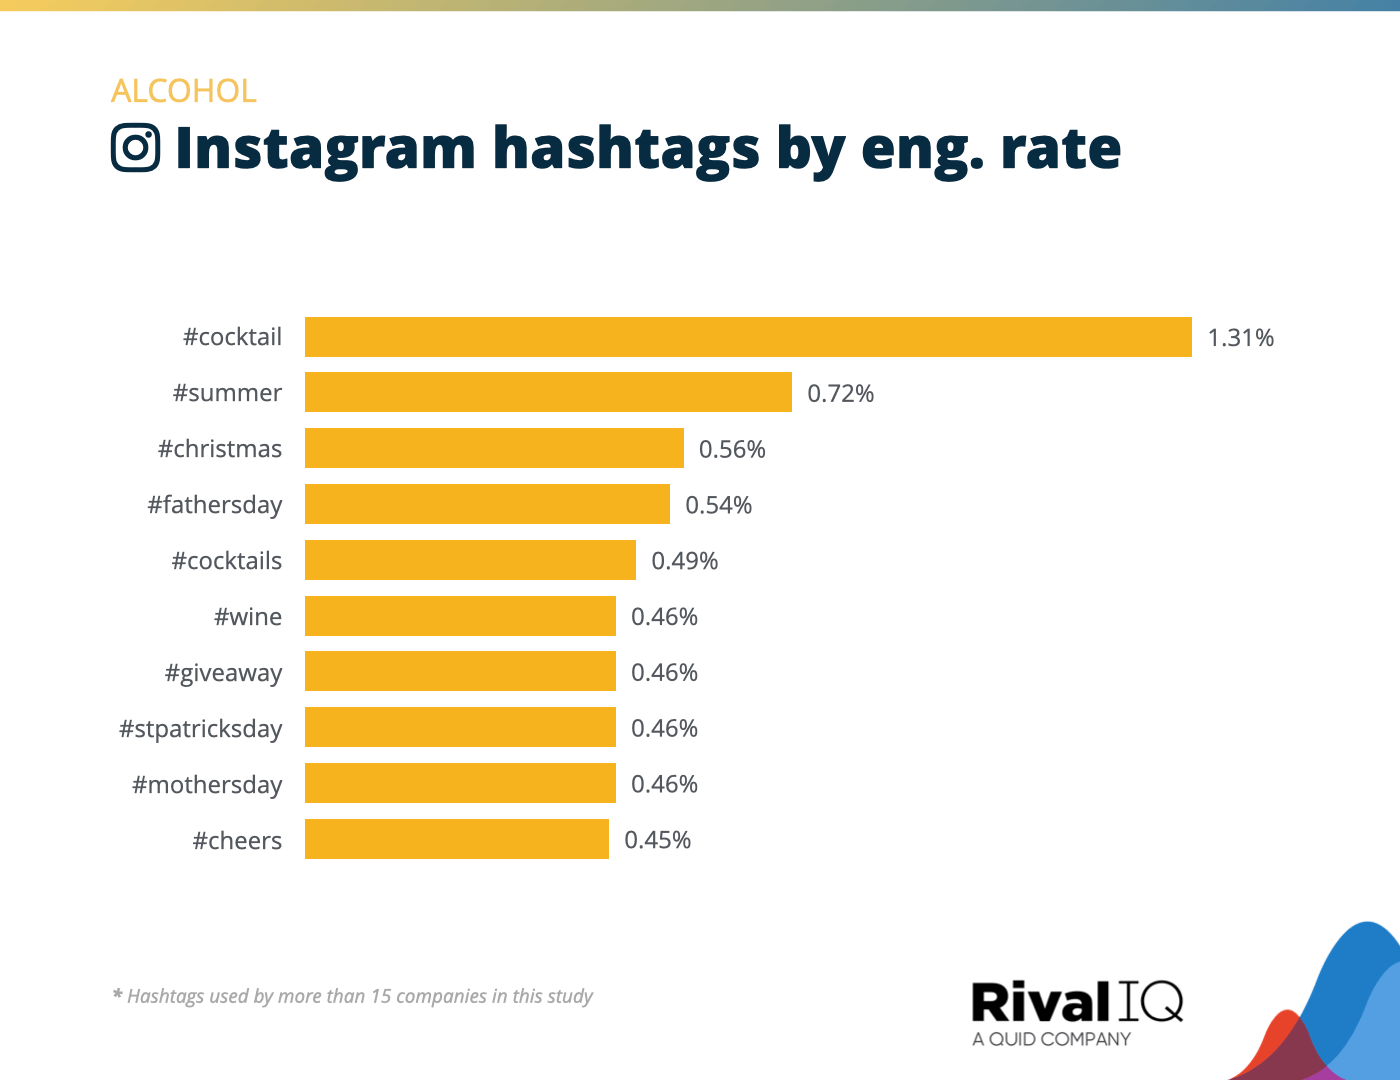
Top Instagram hashtags by engagement rate, Alcohol
Alcohol brands were all about mixed drink hashtags on Instagram this year, with the #cocktail hashtag performing nearly twice as well as the next most engaging hashtag by rate.
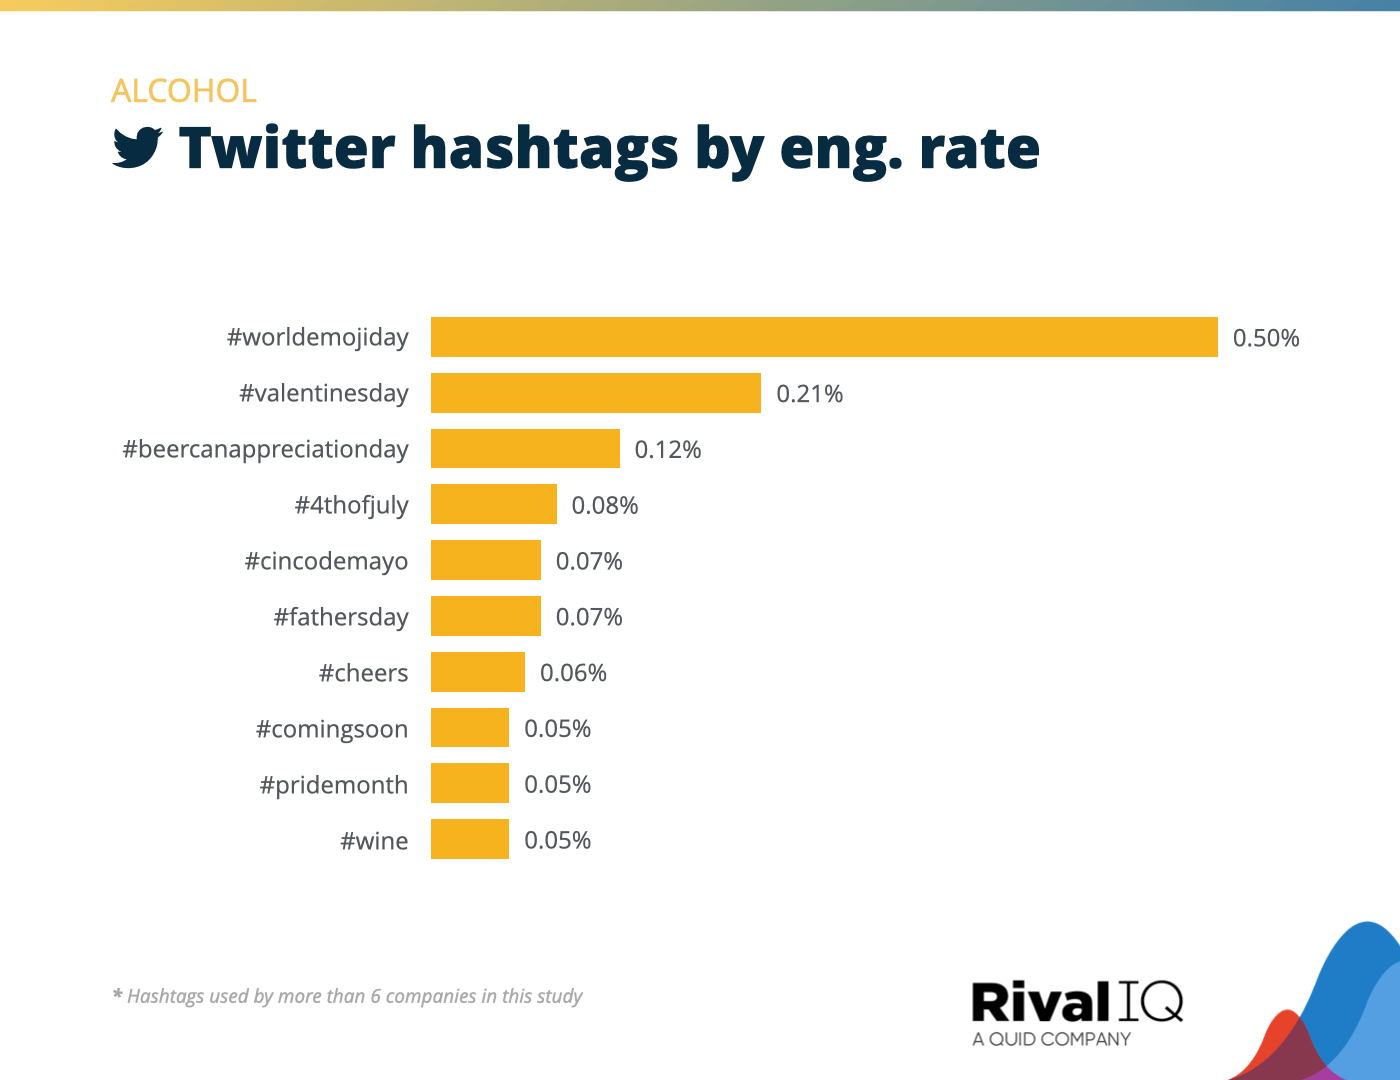
Top Twitter hashtags by engagement rate, Alcohol
Alcohol followers ate up posts with holiday-themed hashtags like #WorldEmojiDay and #ValentinesDay.
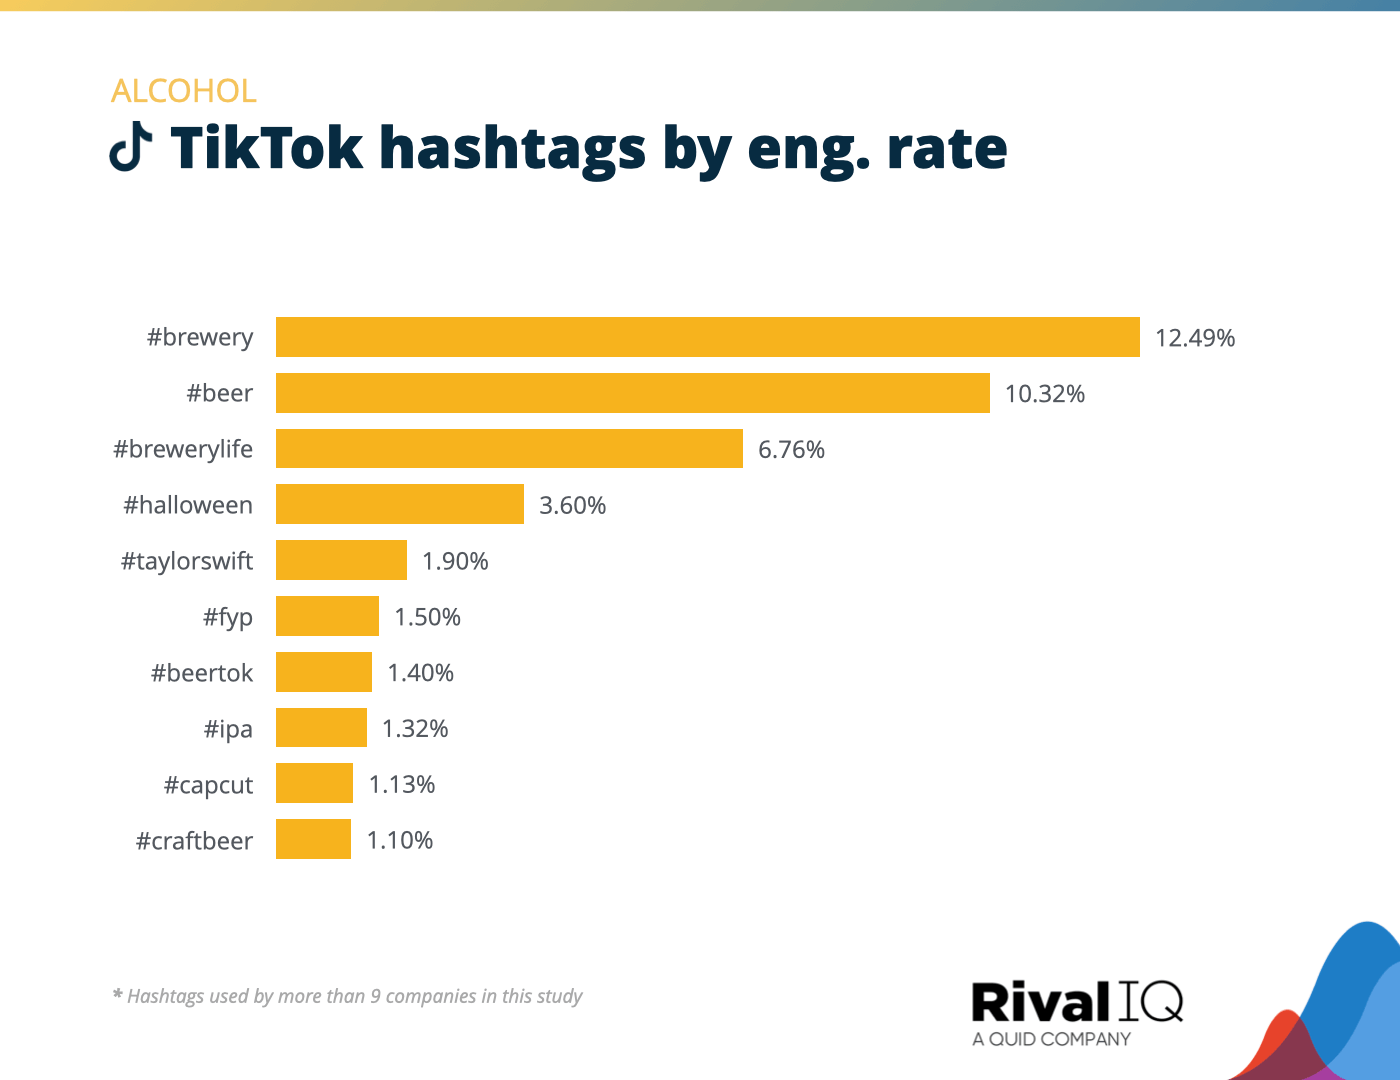
Top TikTok hashtags by engagement rate, Alcohol
While cocktails were king on Instagram, Alcohol brands were all about the beer with their hashtags on TikTok this year.

Snag the full 2024 Benchmark Report
Grab the report nowFashion Social Media Benchmarks
Fashion brands earned less than half the median on every channel we studied this year, proving social media is a crowded and competitive space for these brands.
Some suggestions for Fashion brands:
- Invest more in TikTok, which is paying more engagement dividends than other channels right now.
- With the success of Reels on Instagram and videos on Twitter for fashion brands, video content is where it’s at in the year ahead.
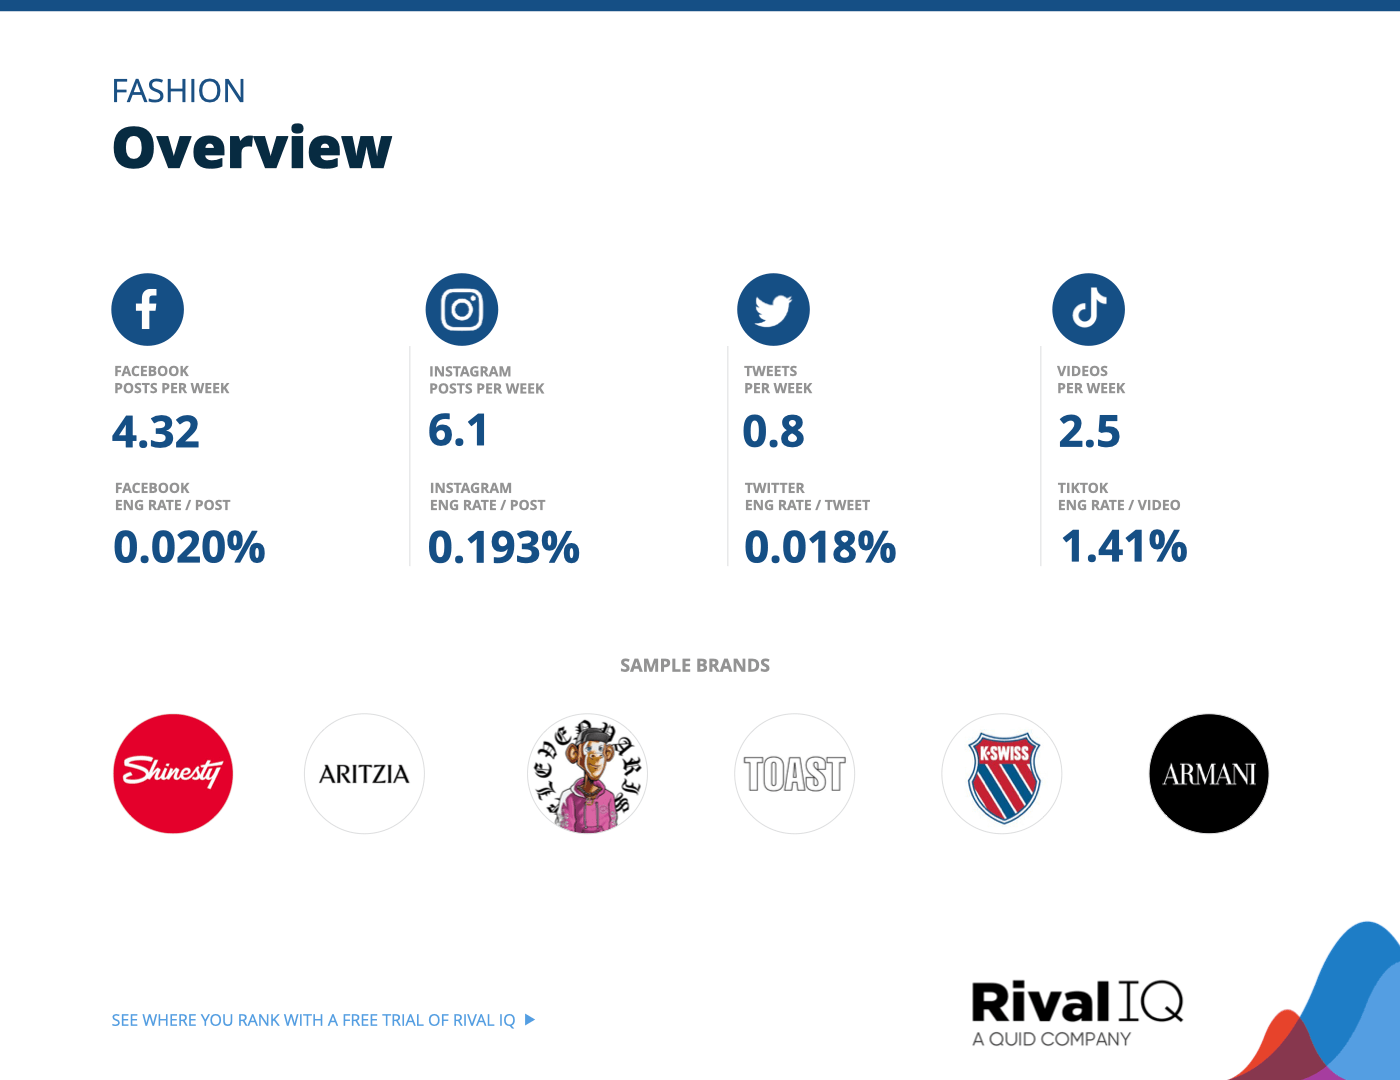
Overview of all benchmarks, Fashion
Notable brands in this year’s report include Aritzia, Eleven Paris, Armani, K-Swiss, Shinesty, and Toast.
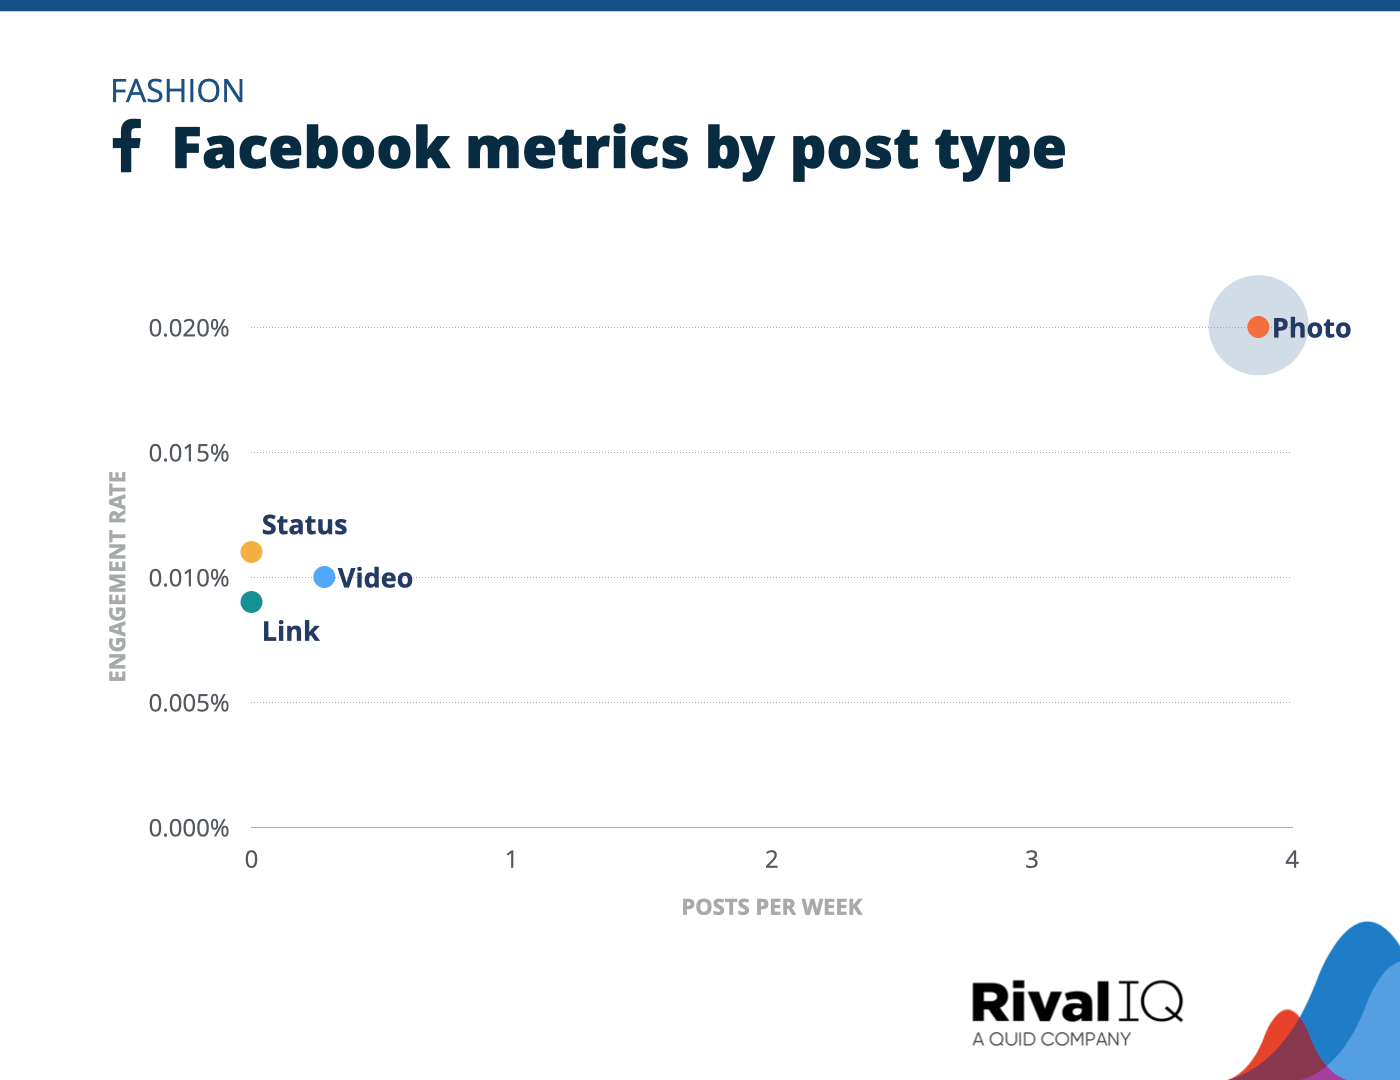
Facebook posts per week and engagement rate by post type, Fashion
Photos were twice as engaging as the next most engaging post type by rate on Facebook for Fashion brands.
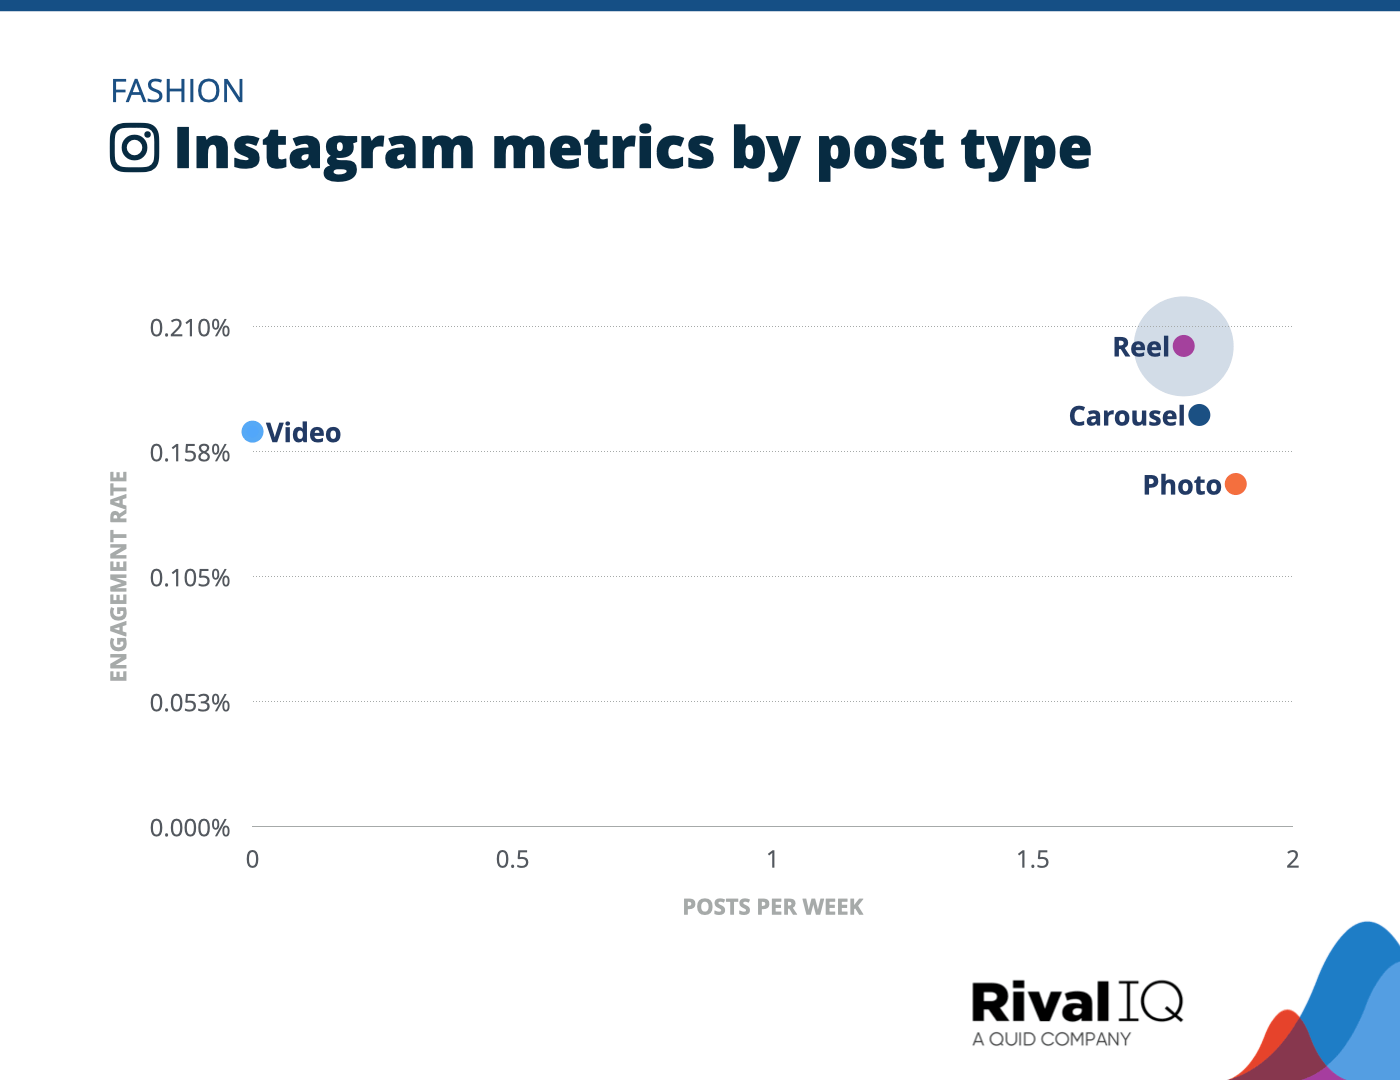
Instagram posts per week and engagement rate by post type, Fashion
Reels beat out carousels for the first time this year for Fashion brands on Instagram. Streetwear brand CLOAK beat out Fashion competitors on Instagram this year thanks in part to strong Reels.
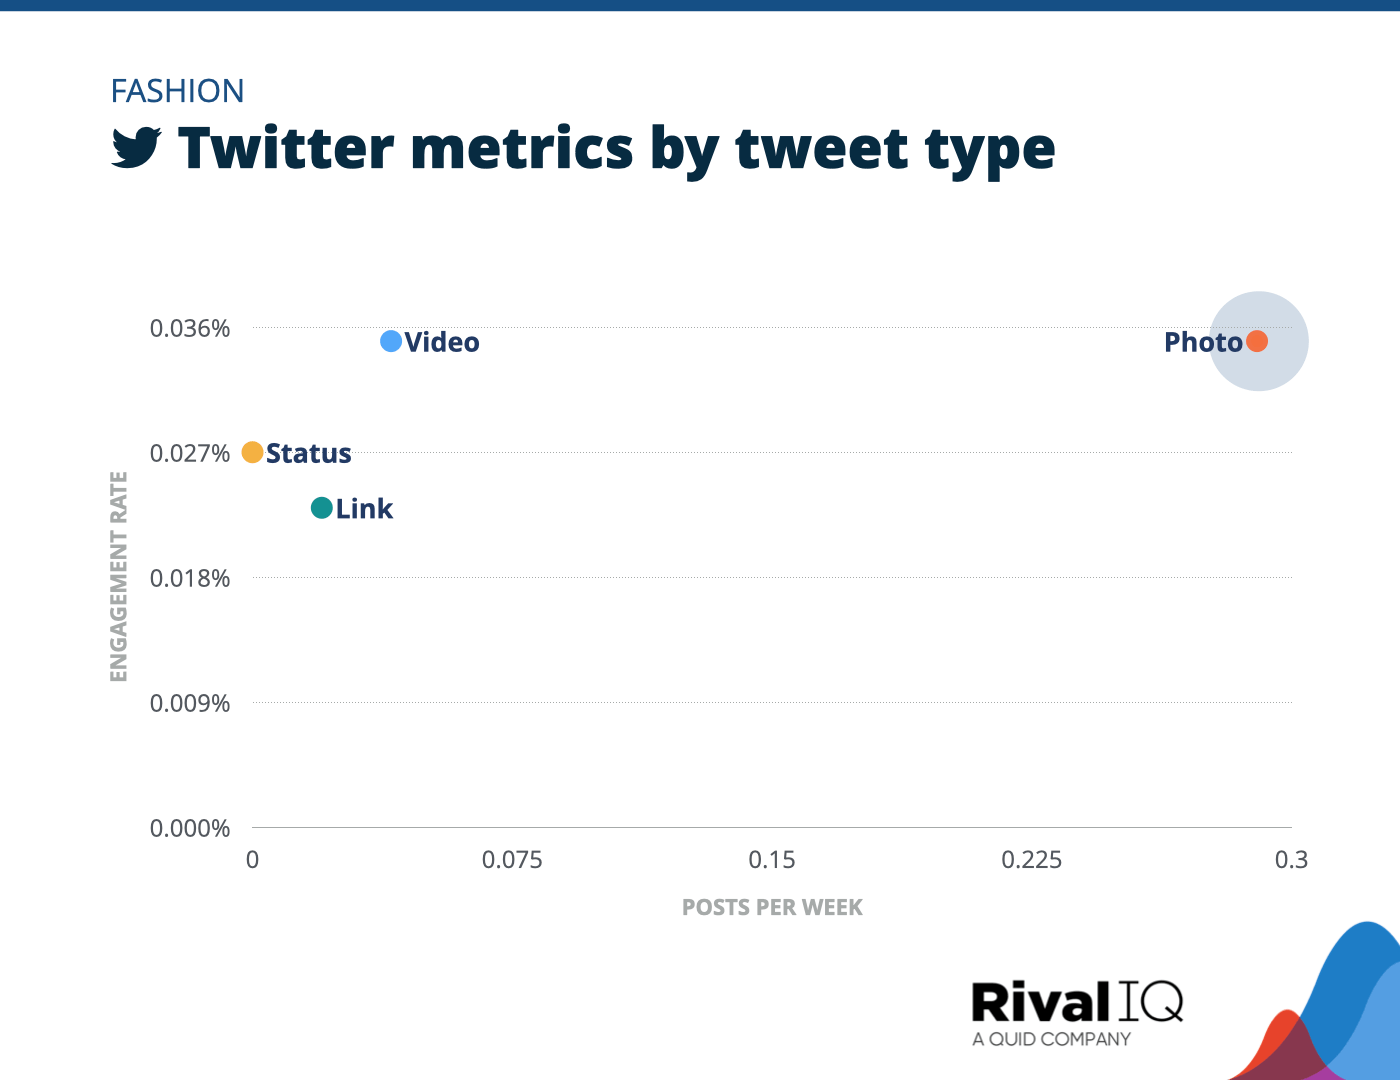
Twitter posts per week and engagement rate by tweet type, Fashion
Fashion brands earned similar engagement rates for video and photos tweets, but were 7x more likely to tweet a photo.
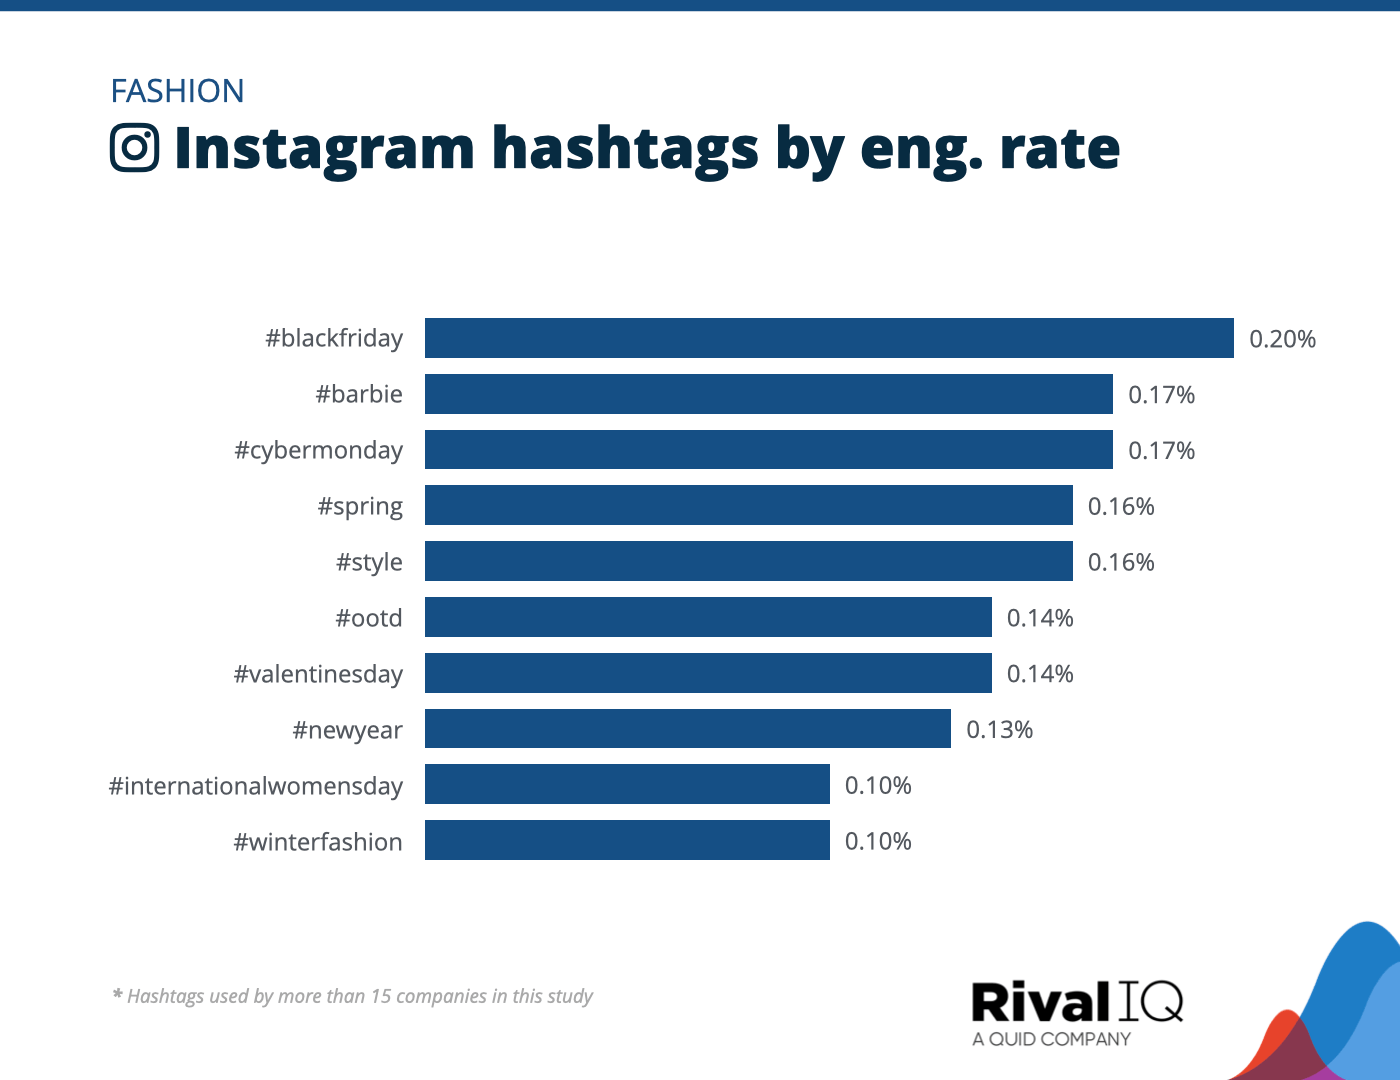
Top Instagram hashtags by engagement rate, Fashion
No surprise here that Fashion brands used hashtags on Instagram like #BlackFriday and #CyberMonday to remind followers about opportunities to shop.
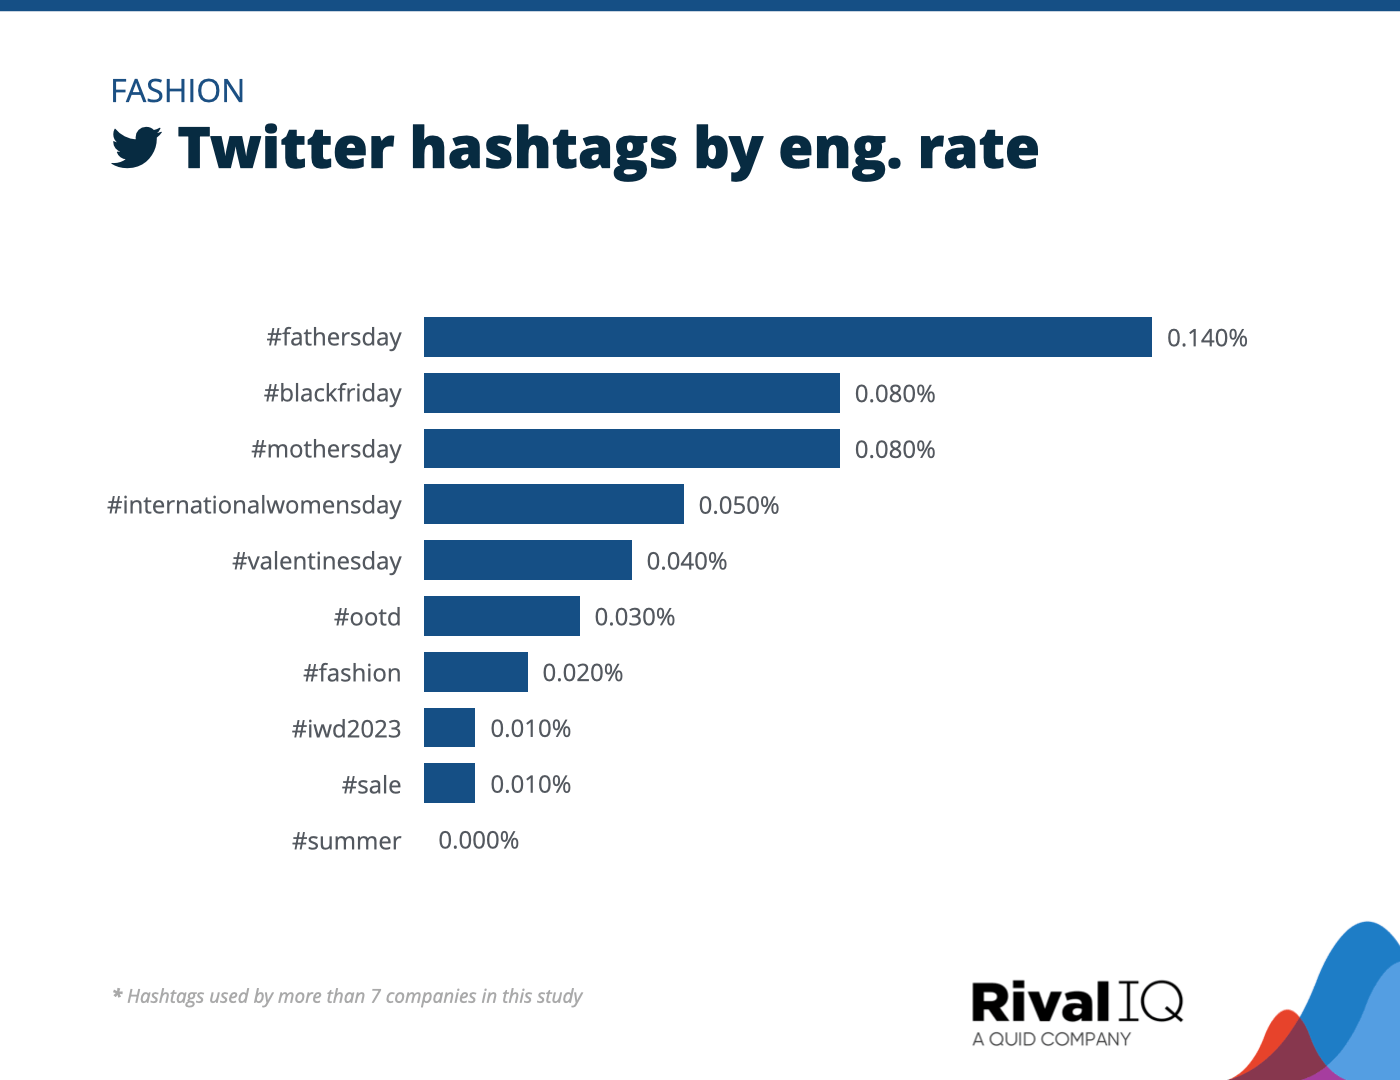
Top Twitter hashtags by engagement rate, Fashion
Gift-focused holidays like #FathersDay and #ValentinesDay topped the engagement charts for Fashion brands on Twitter this year.
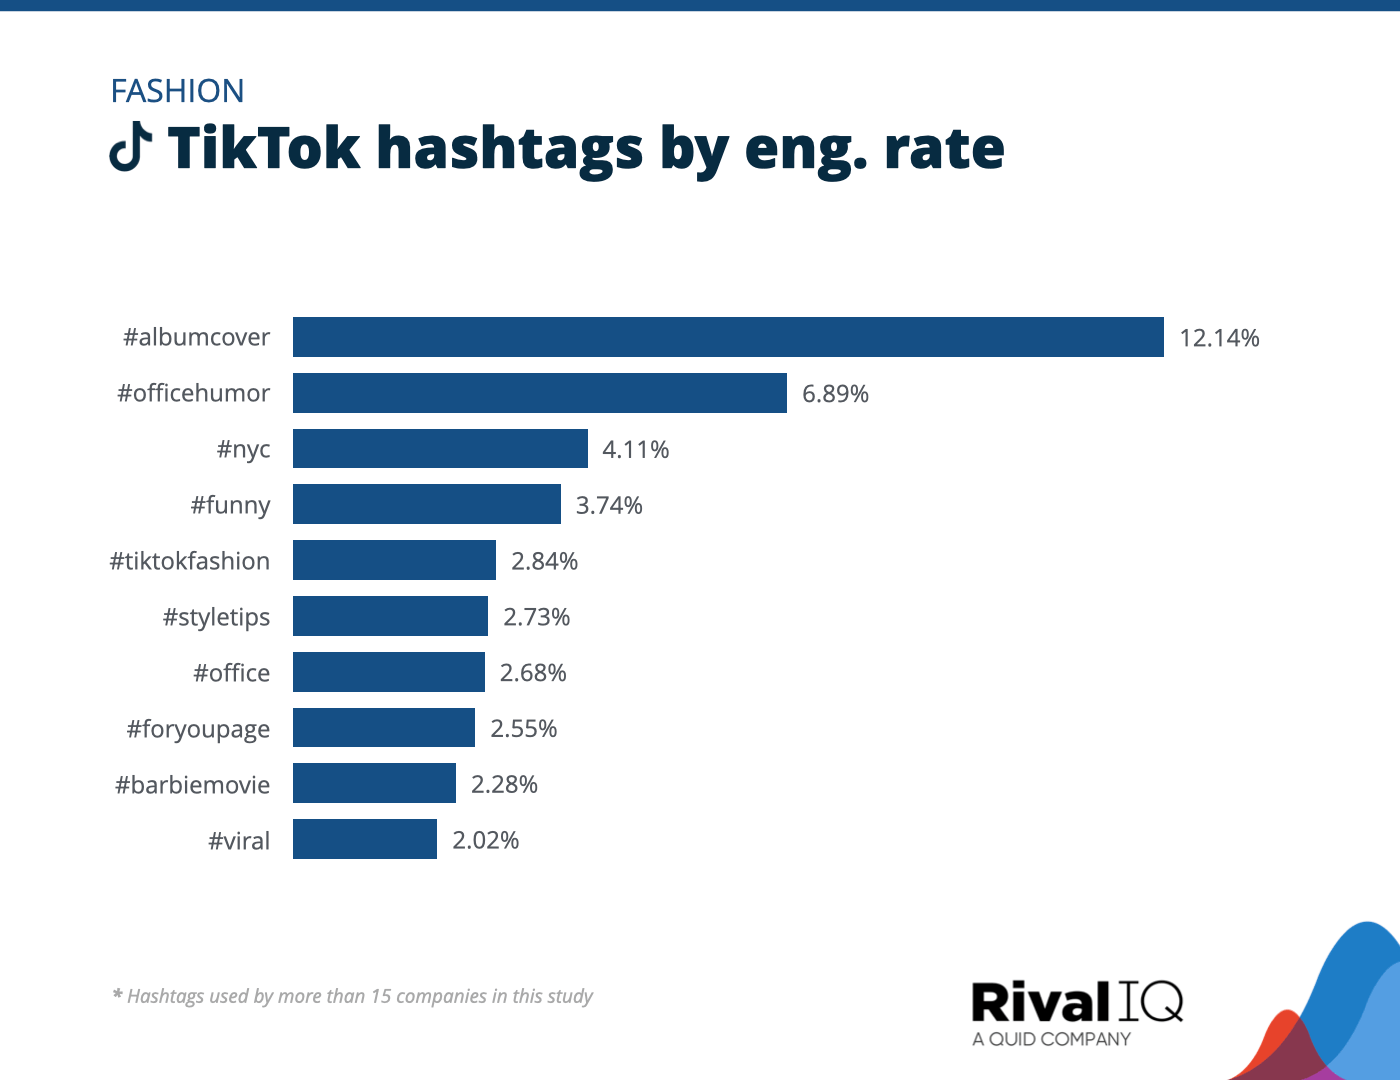
Top TikTok hashtags by engagement rate, Fashion
Fashion brands really jumped on the #AlbumCover trend this year, which immortalized one epic photo in a TikTok video that had influencers and trendsetters putting forth their most aesthetic outfits.
Financial Services Social Media Benchmarks
Financial Services brands sat at or below the median on all four channels we studied this year, despite increasing post frequency across the board.
A few ideas for Financial Services brands:
- Photos are a top-performing post type across Facebook, Instagram, and Twitter, so don’t be afraid to get visual.
- Educational hashtags like #MoneyTok and #MoneyTips were top performers, proving FinServ followers are down to learn.
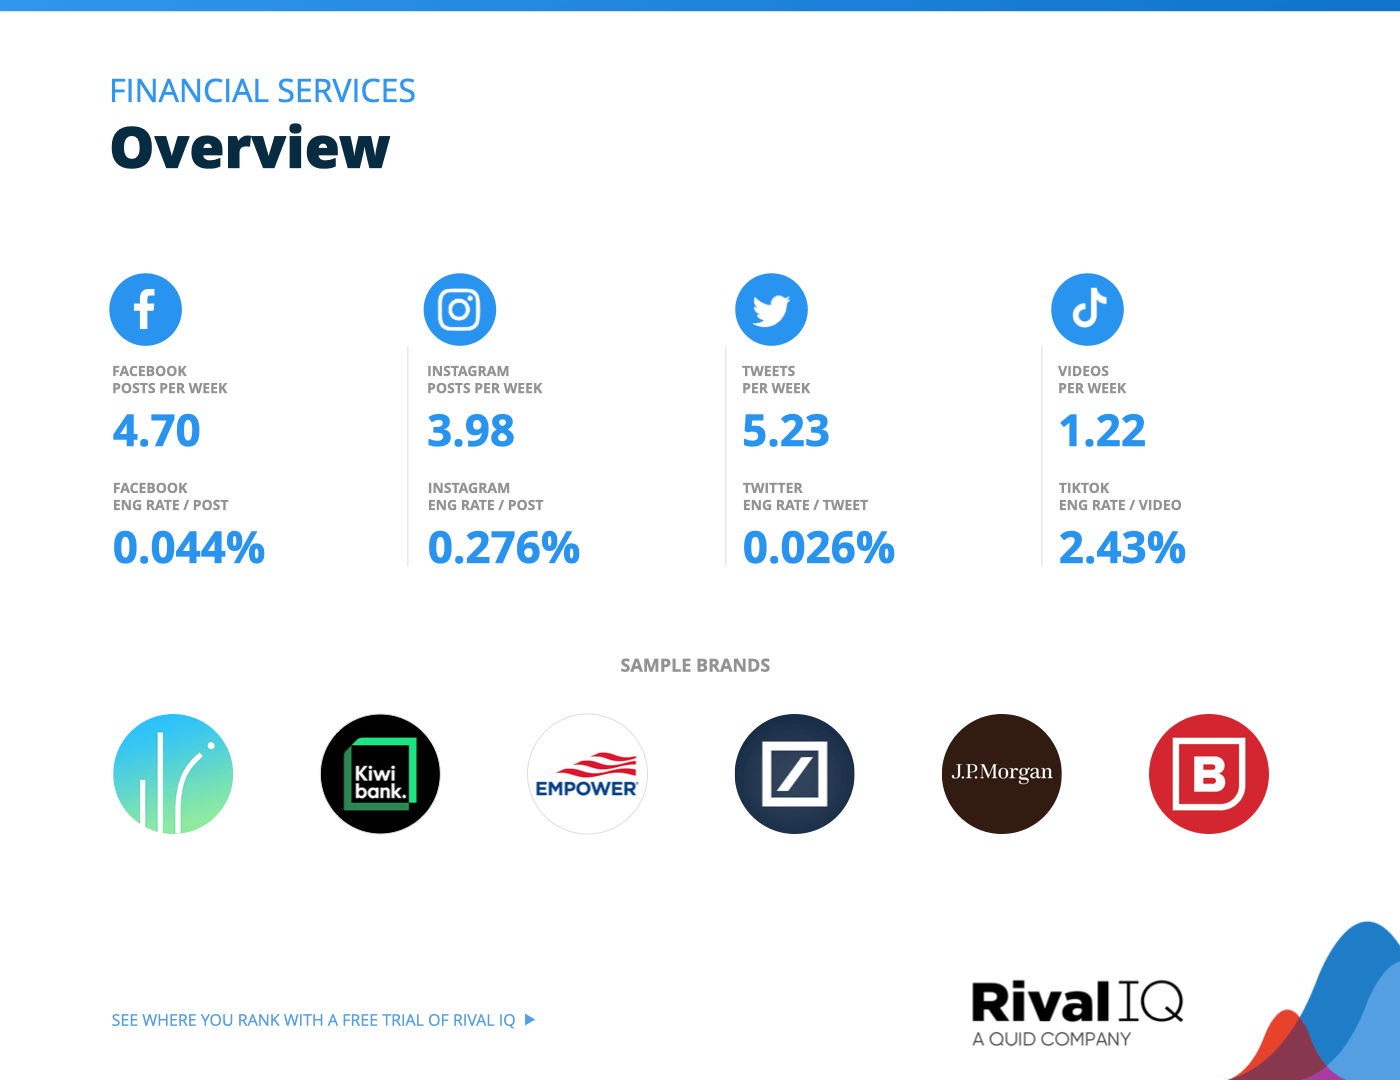
Overview of all benchmarks, Financial Services
Notable brands in this year’s report include BECU, Deutsche Bank, Empower, J.P. Morgan, Kiwi Bank, and Sallie Mae.
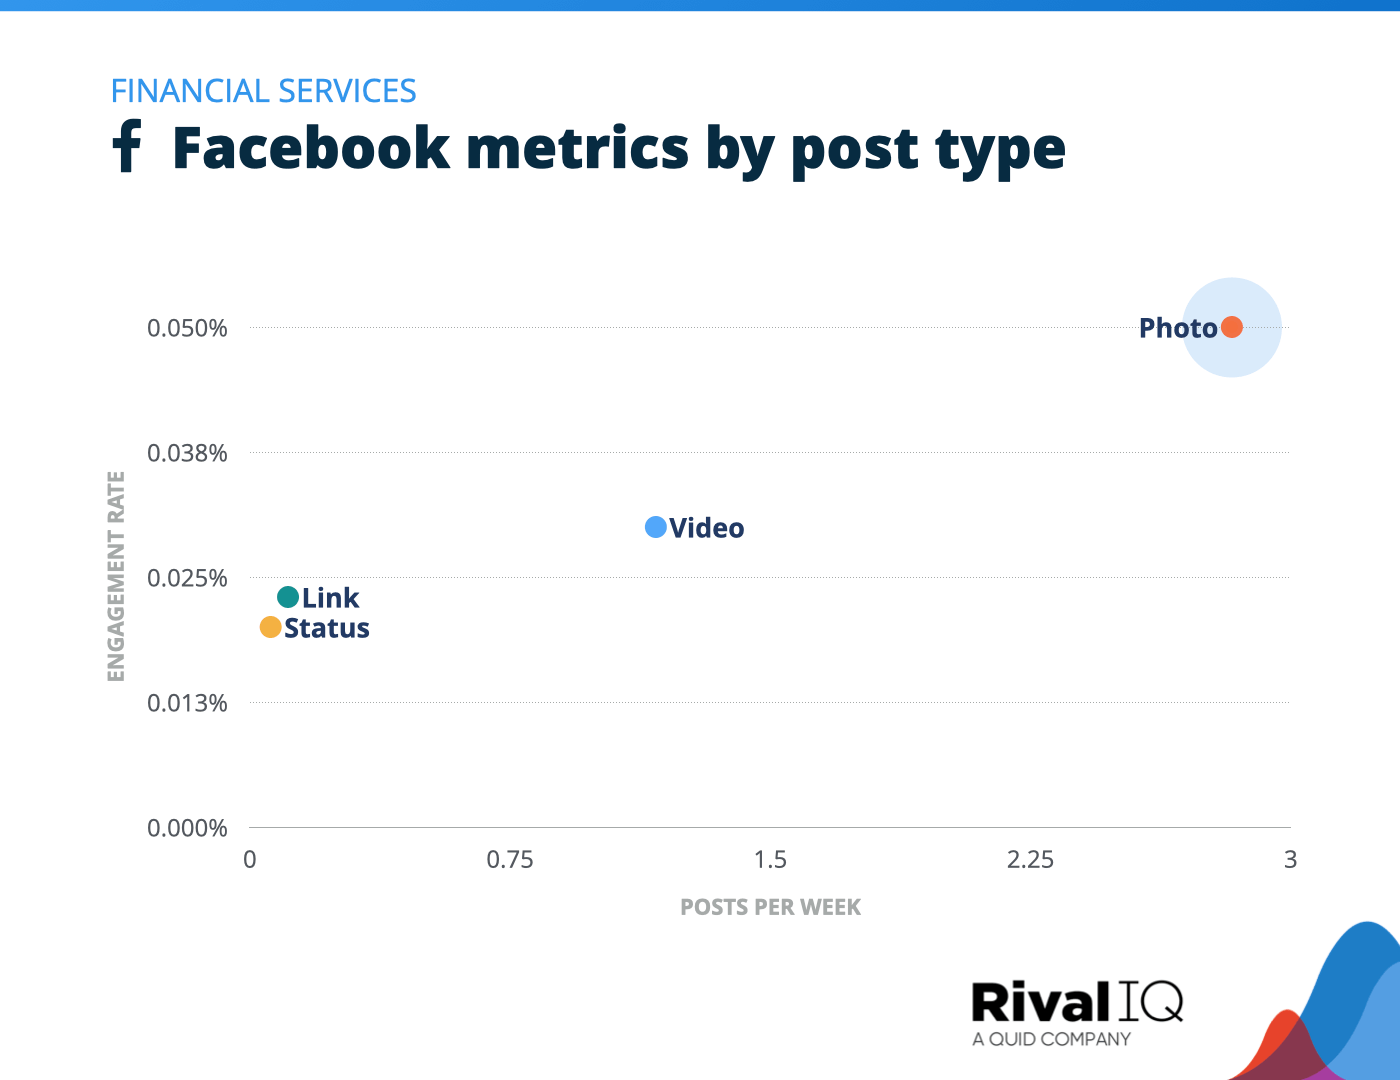
Facebook posts per week and engagement rate by post type, Financial Services
Photo posts beat out the next most engaging post type by a mile for Financial Services brands on Facebook. Bonus: these posts also earn twice the engagement rates they did last year.
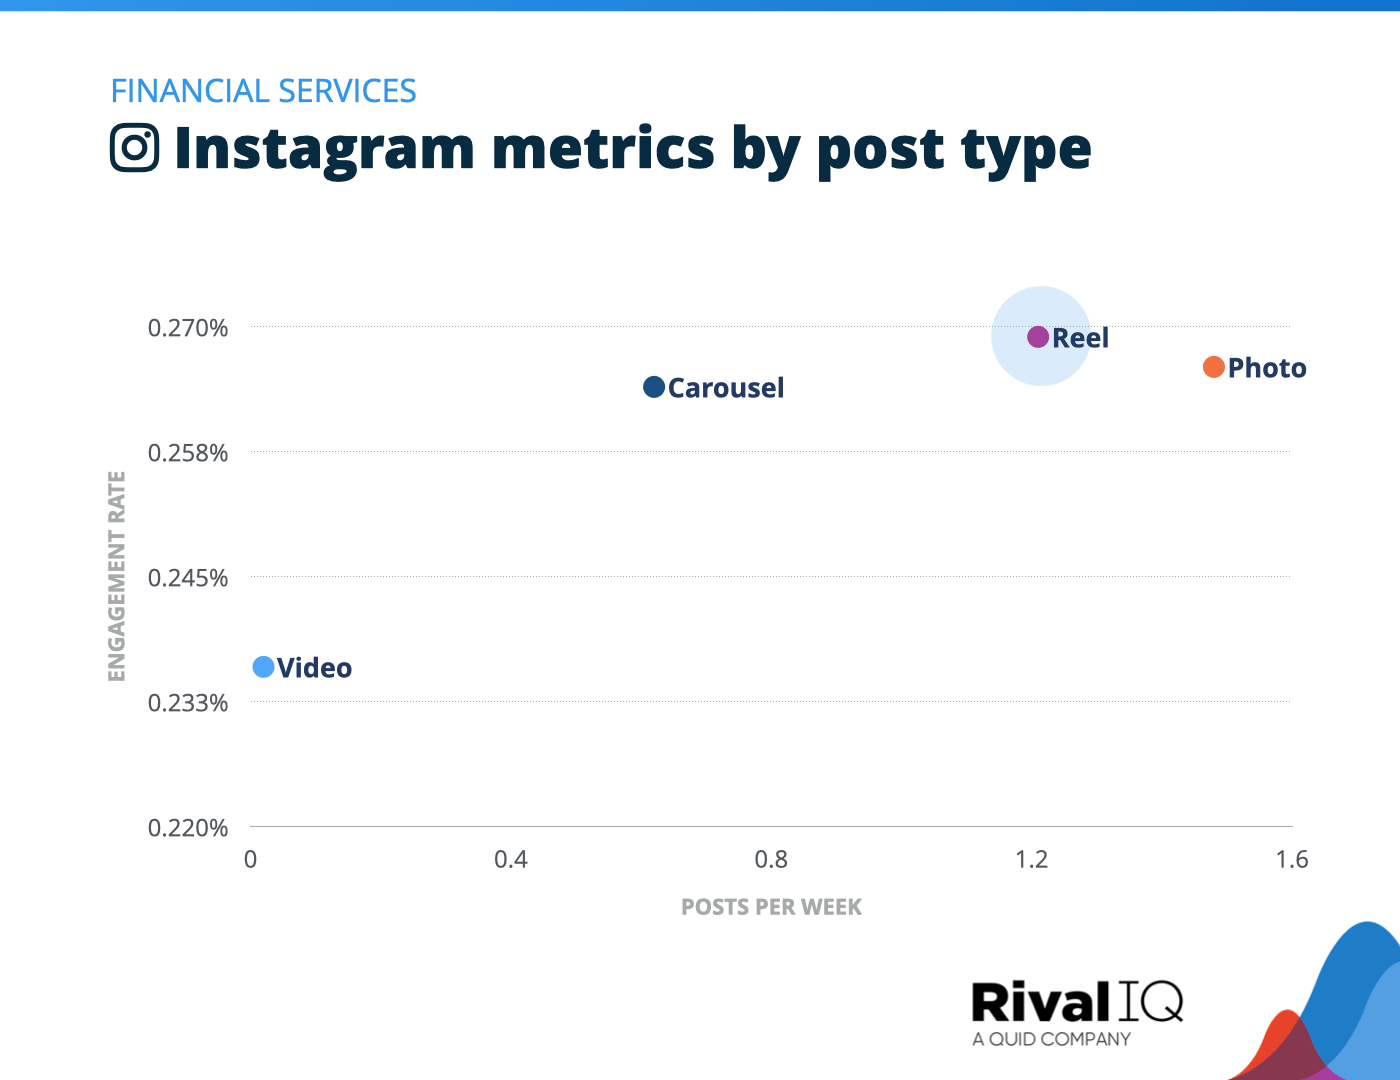
Instagram posts per week and engagement rate by post type, Financial Services
Reels and photos vied for first for Financial Services brands on Instagram this year, with video posts lagging majorly.
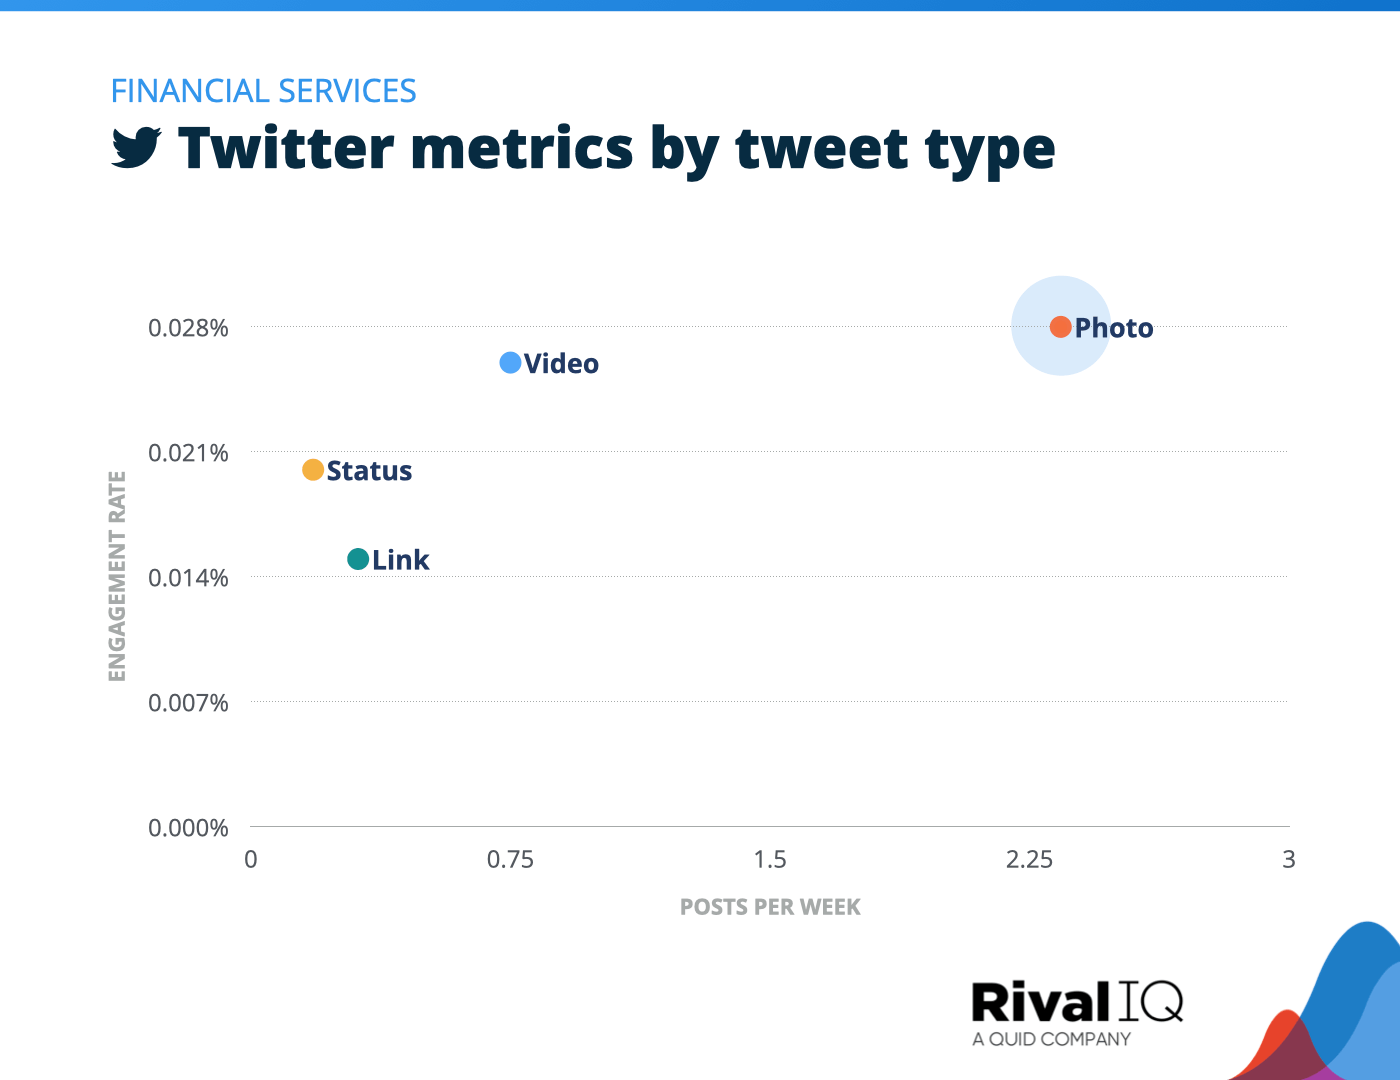
Twitter posts per week and engagement rate by tweet type, Financial Services
Video and photo tweets outpaced status updates and links for Financial Services brands on Twitter this year.
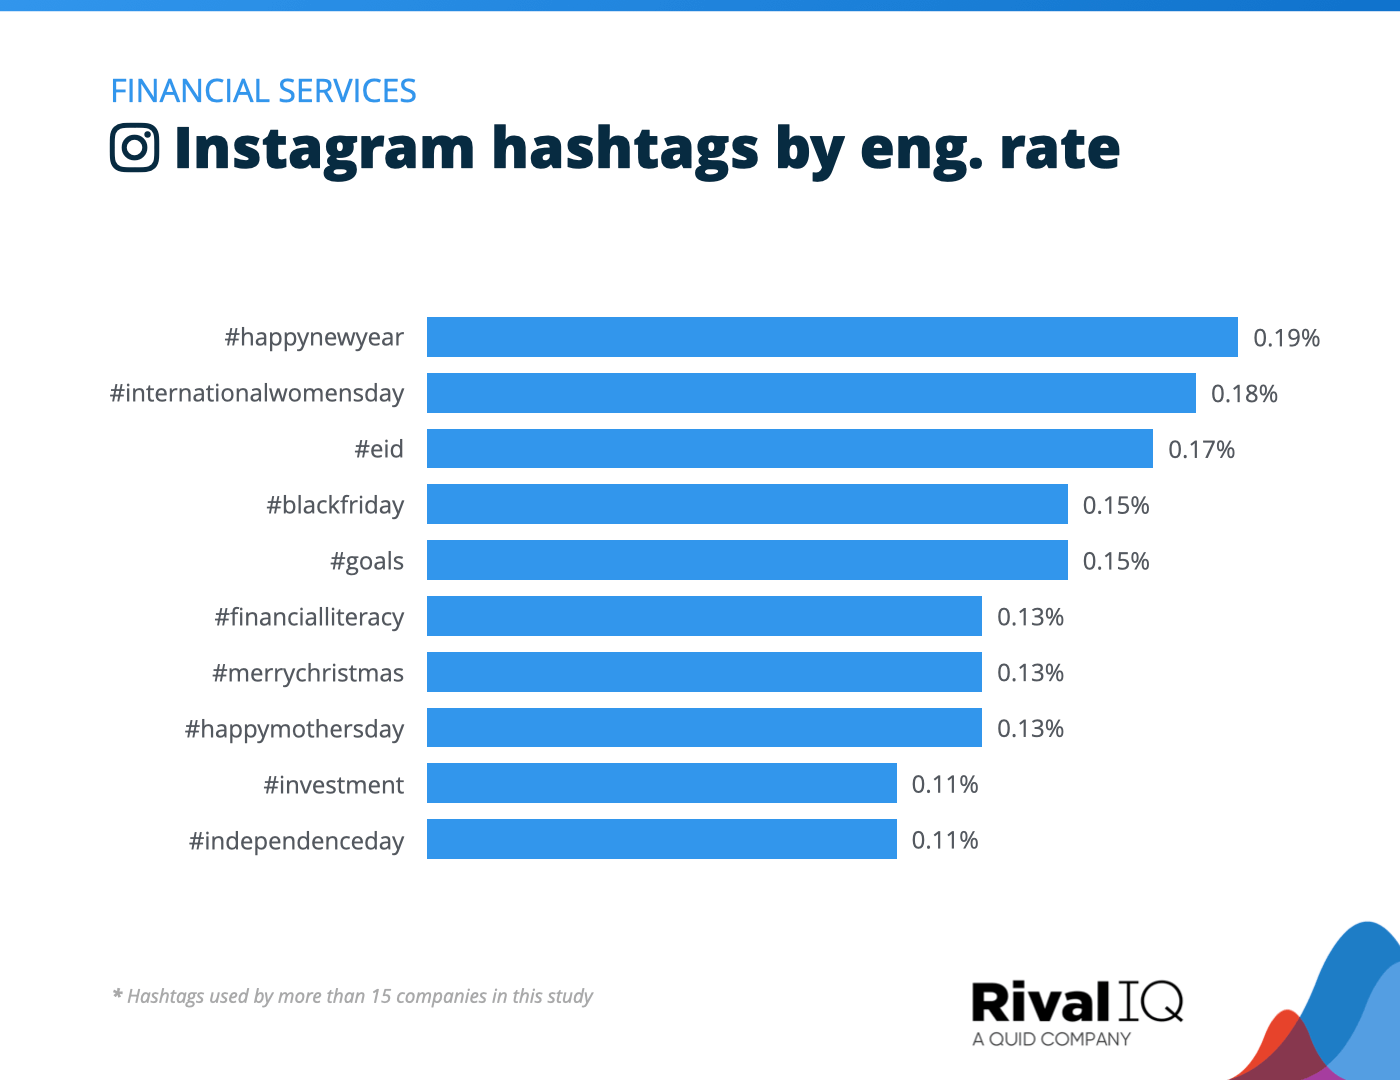
Top Instagram hashtags by engagement rate, Financial Services
Financial Services brands didn’t miss an opportunity to connect with followers on holidays like Christmas, International Women’s Day, and Mother’s Day.
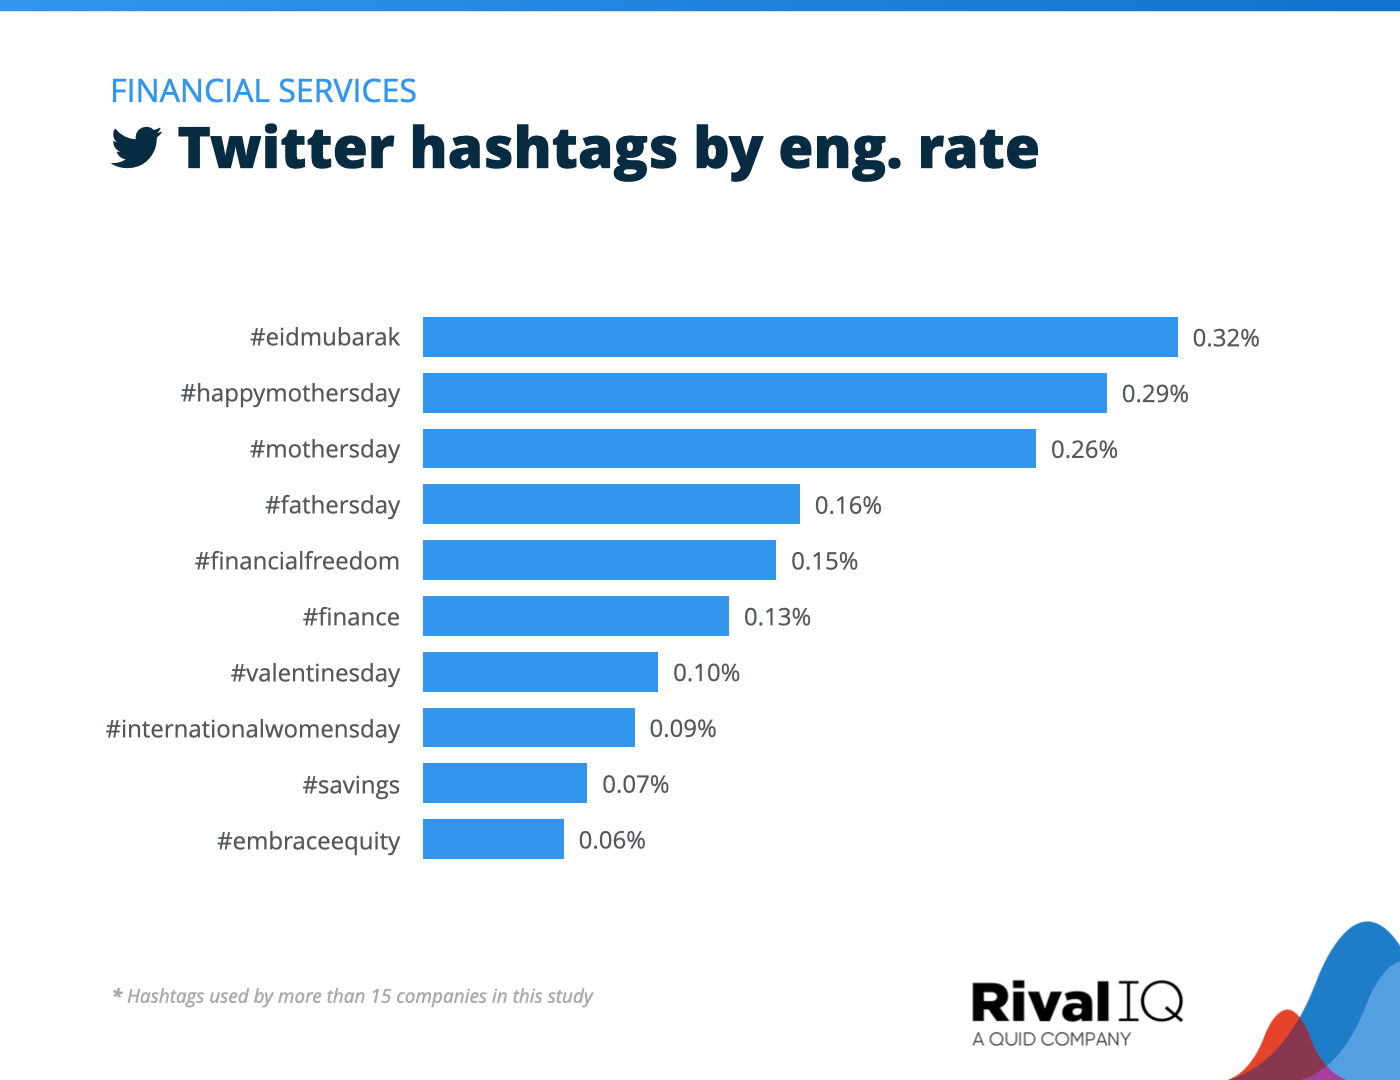
Top Twitter hashtags by engagement rate, Financial Services
Financial Services brands were all about holiday and finance hashtags this year on Twitter.
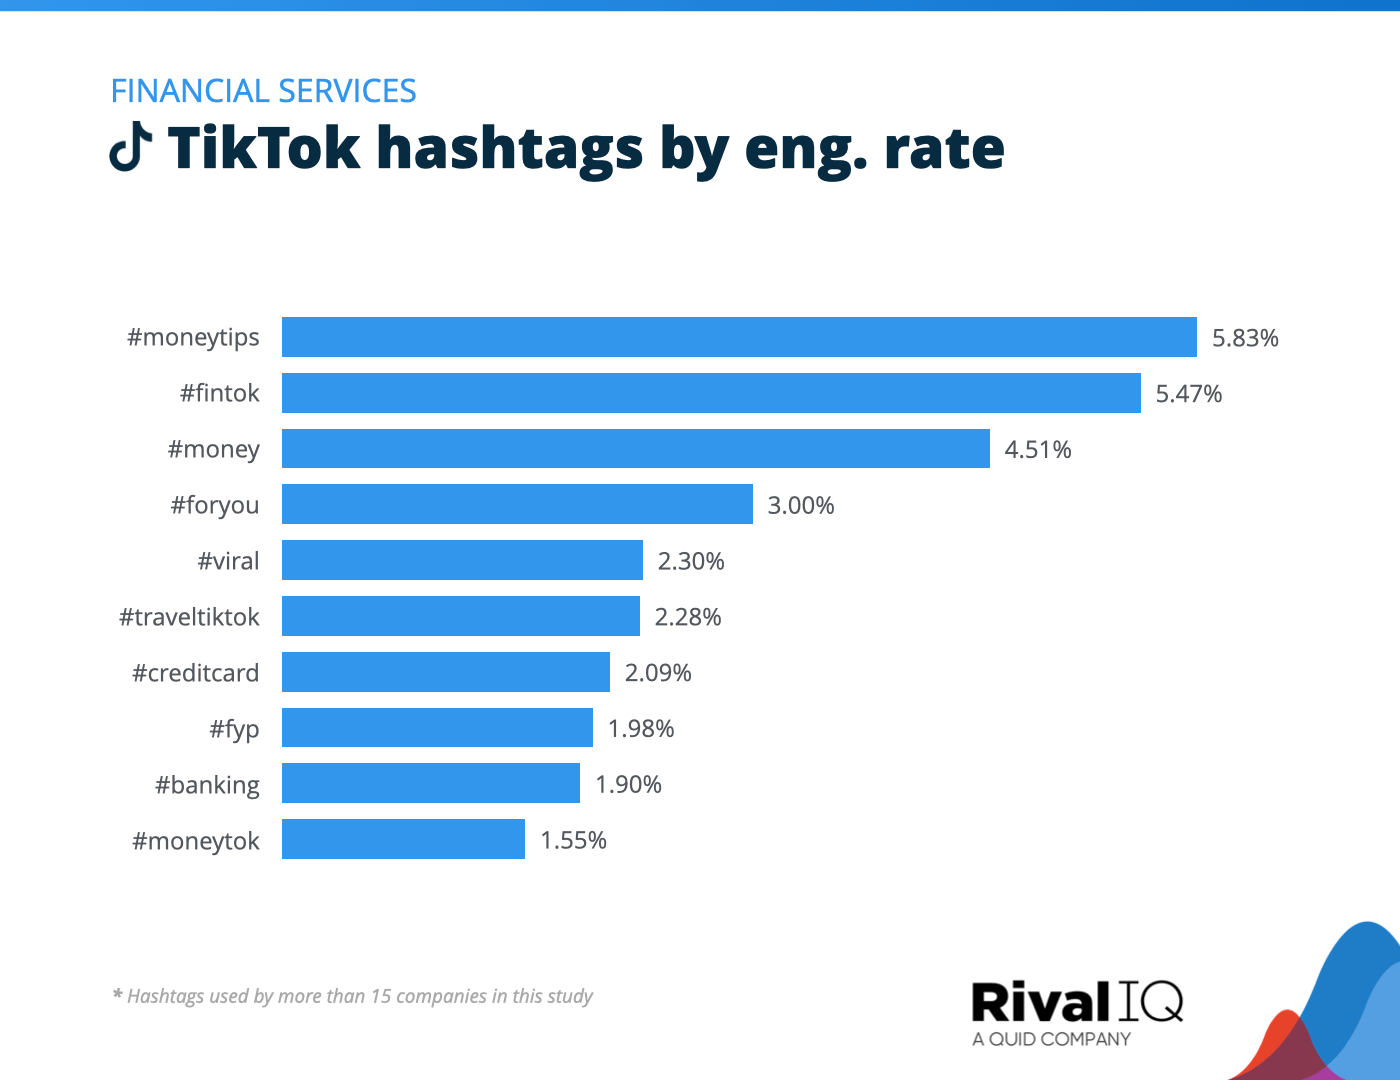
Top TikTok hashtags by engagement rate, Financial Services
While holiday-themed hashtags dominated for FinServ brands on Instagram and Twitter, these brands focused on getting down to business more on TikTok with hashtags like #MoneyTips and #MoneyTok.
Food & Beverage Social Media Benchmarks
Food & Beverage brands saw the highest engagement rates on video-focused Instagram and TikTok while struggling a bit on other channels.
Some ideas for improvement:
- Holidays are always a good time to start conversations with followers about recipes and menu planning.
- The #EmbraceEquity hashtag was a runaway hit on Twitter, so don’t be afraid to go beyond the plate when creating content.
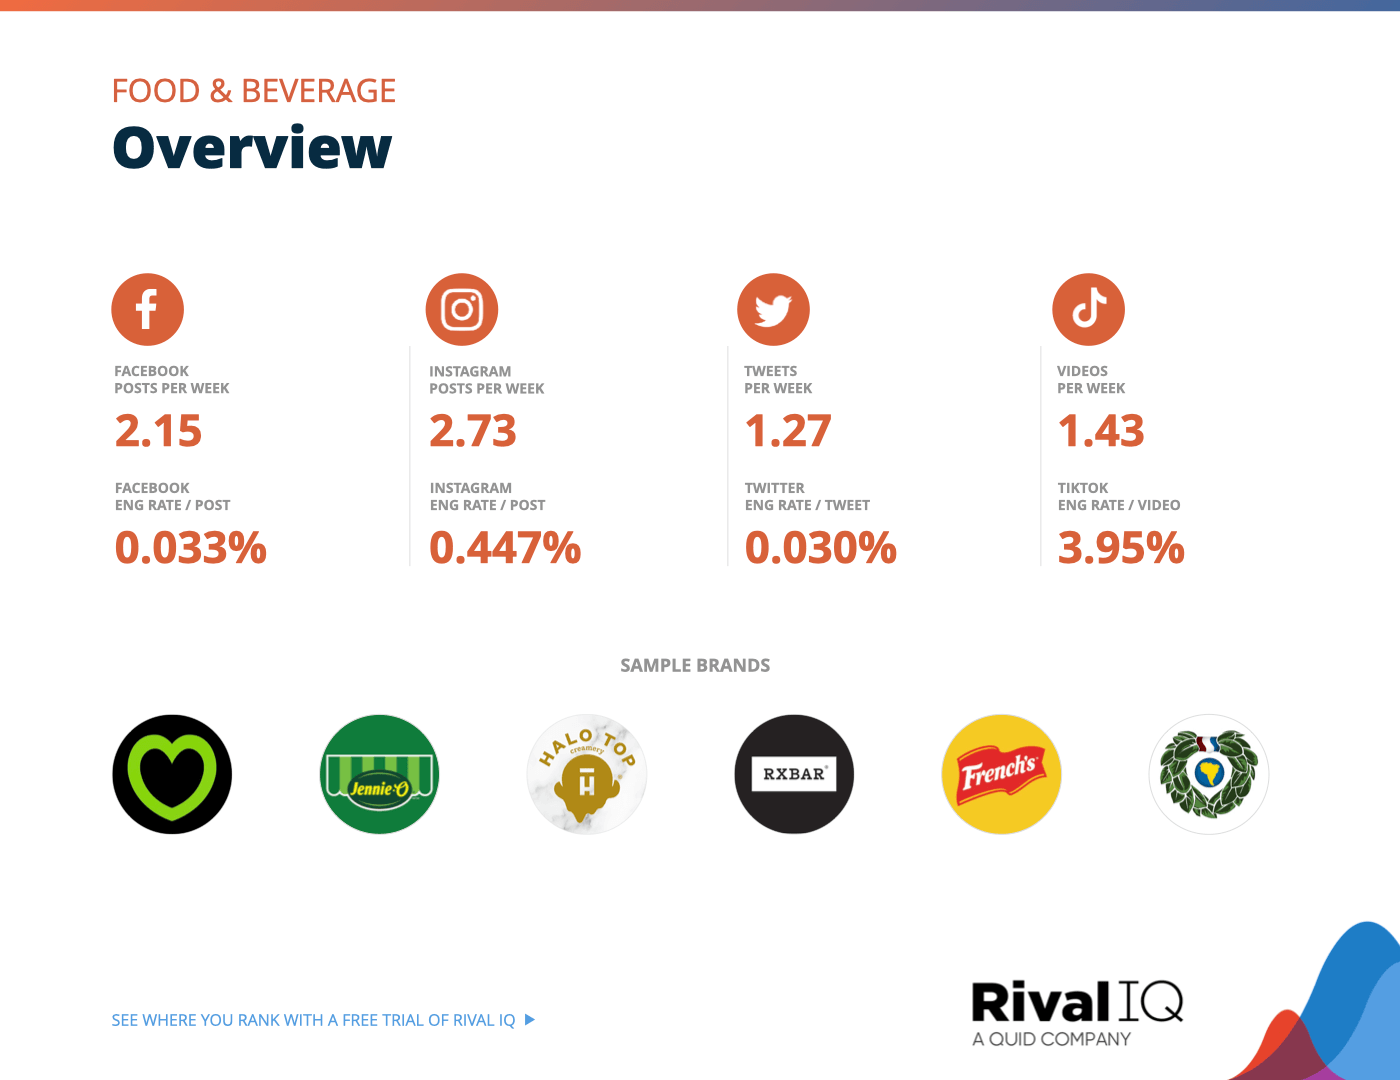
Overview of all benchmarks, Food & Beverage
Notable brands in this year’s report include French’s, Guayaki Yerba Mate, Halo Top, Jennie-O, RXBar, and Wonderful Pistachios.
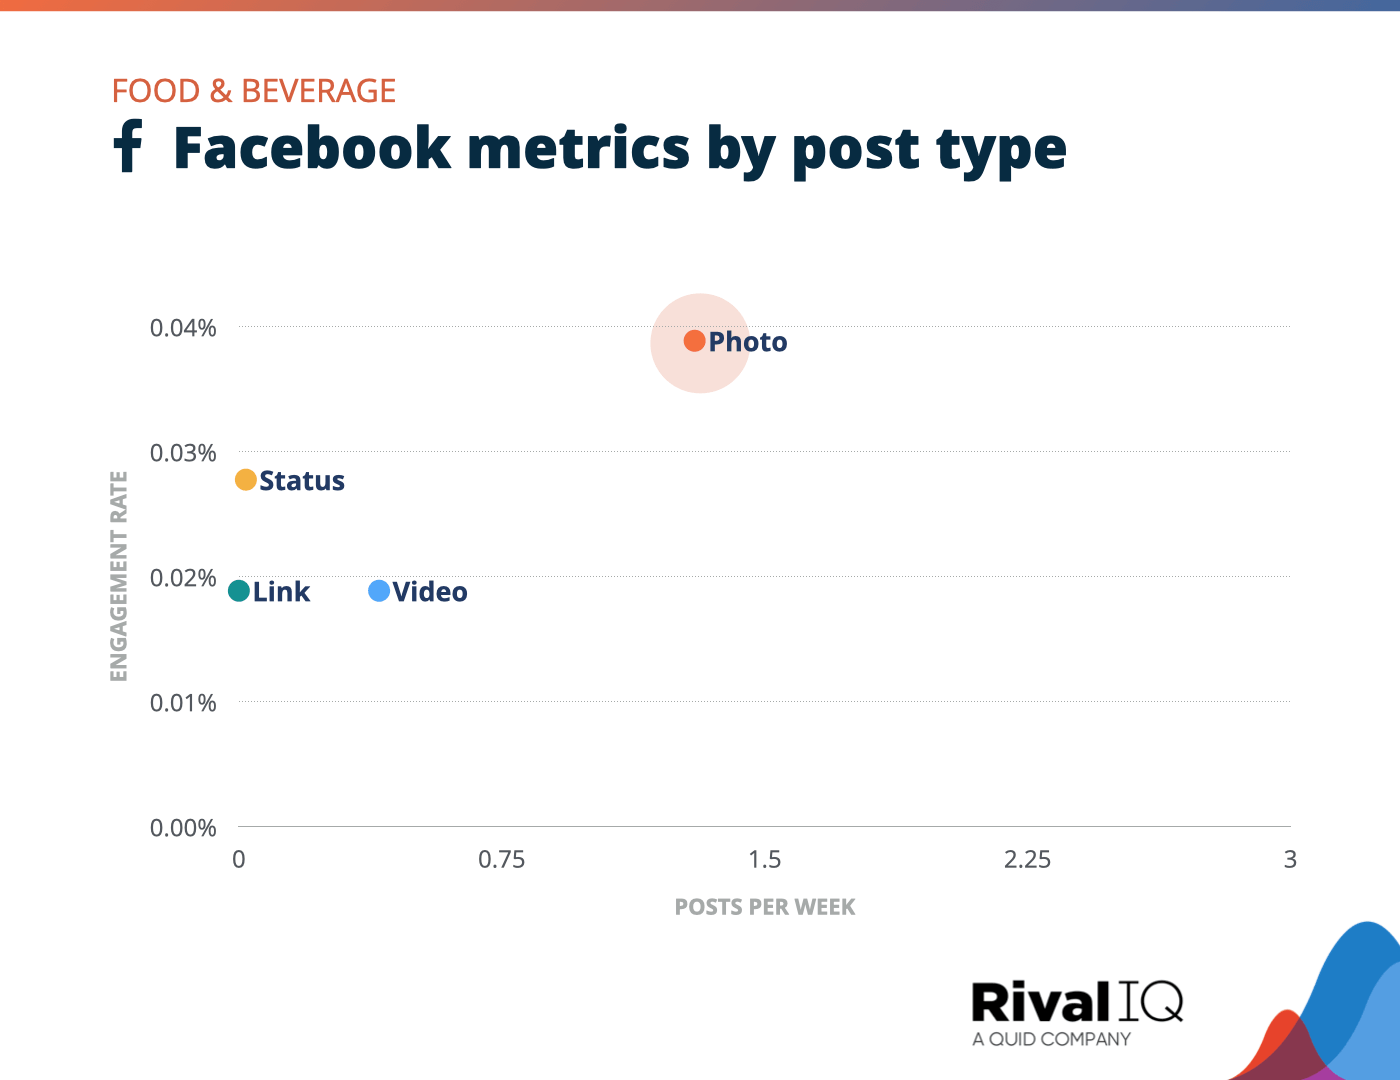
Facebook posts per week and engagement rate by post type, Food & Beverage
Photo posts stood out for Food & Beverage brands on Facebook this year hoping to entice followers to connect IRL with mouthwatering snaps of their offerings.
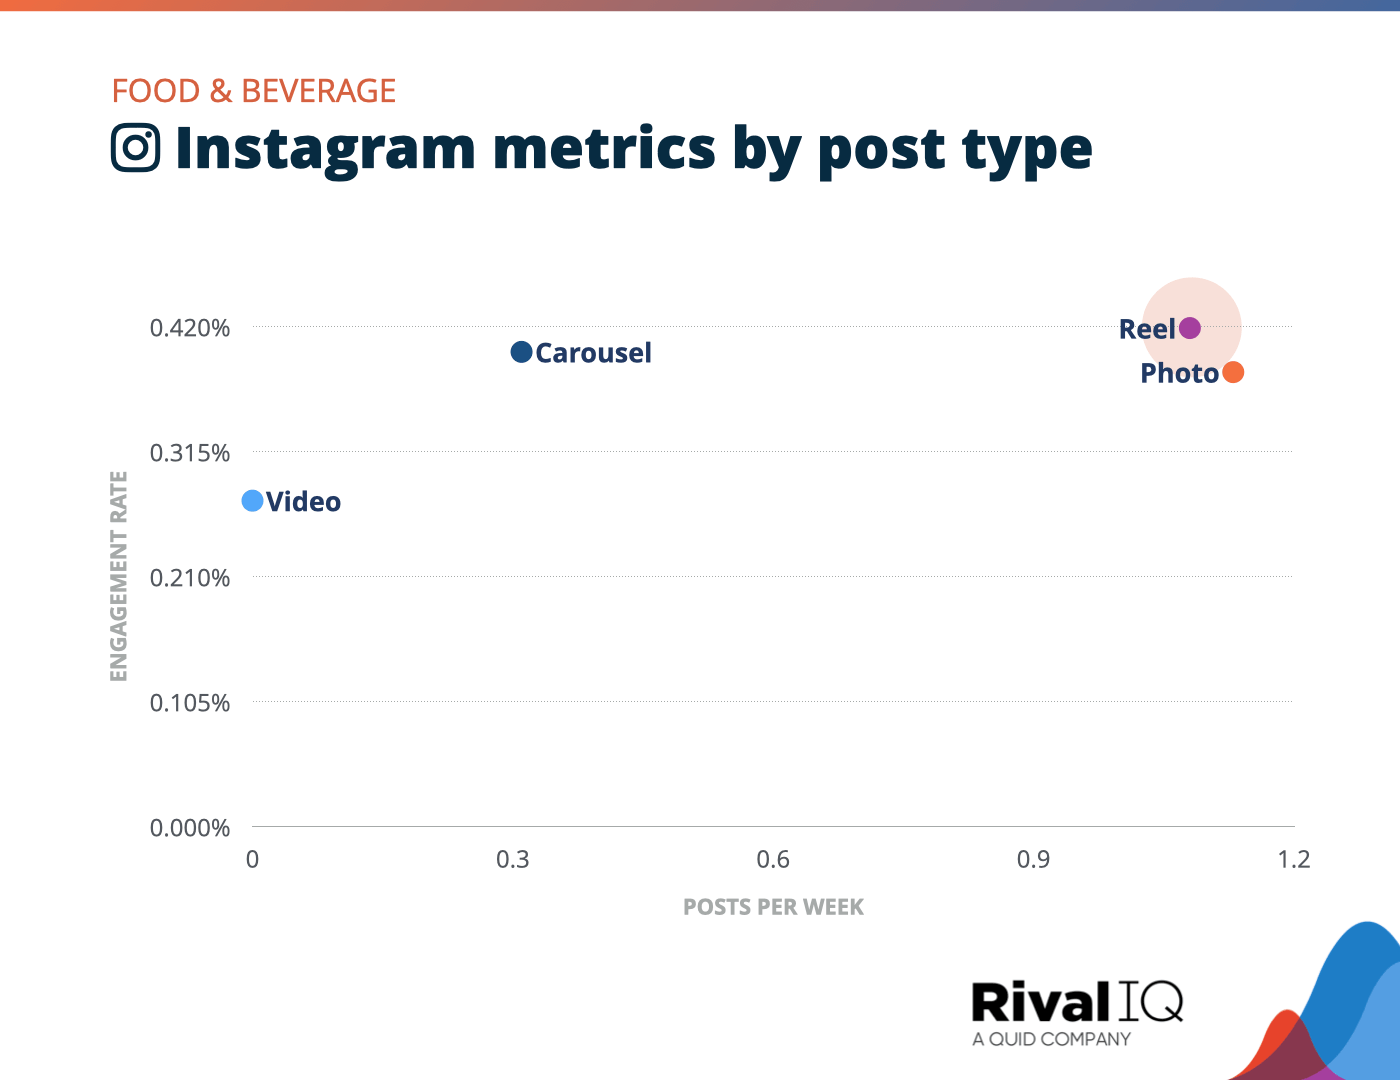
Instagram posts per week and engagement rate by post type, Food & Beverage
Food & Beverage brands shifted their content creation energy from videos to Reels this year, which paid off with impressive engagement rates.
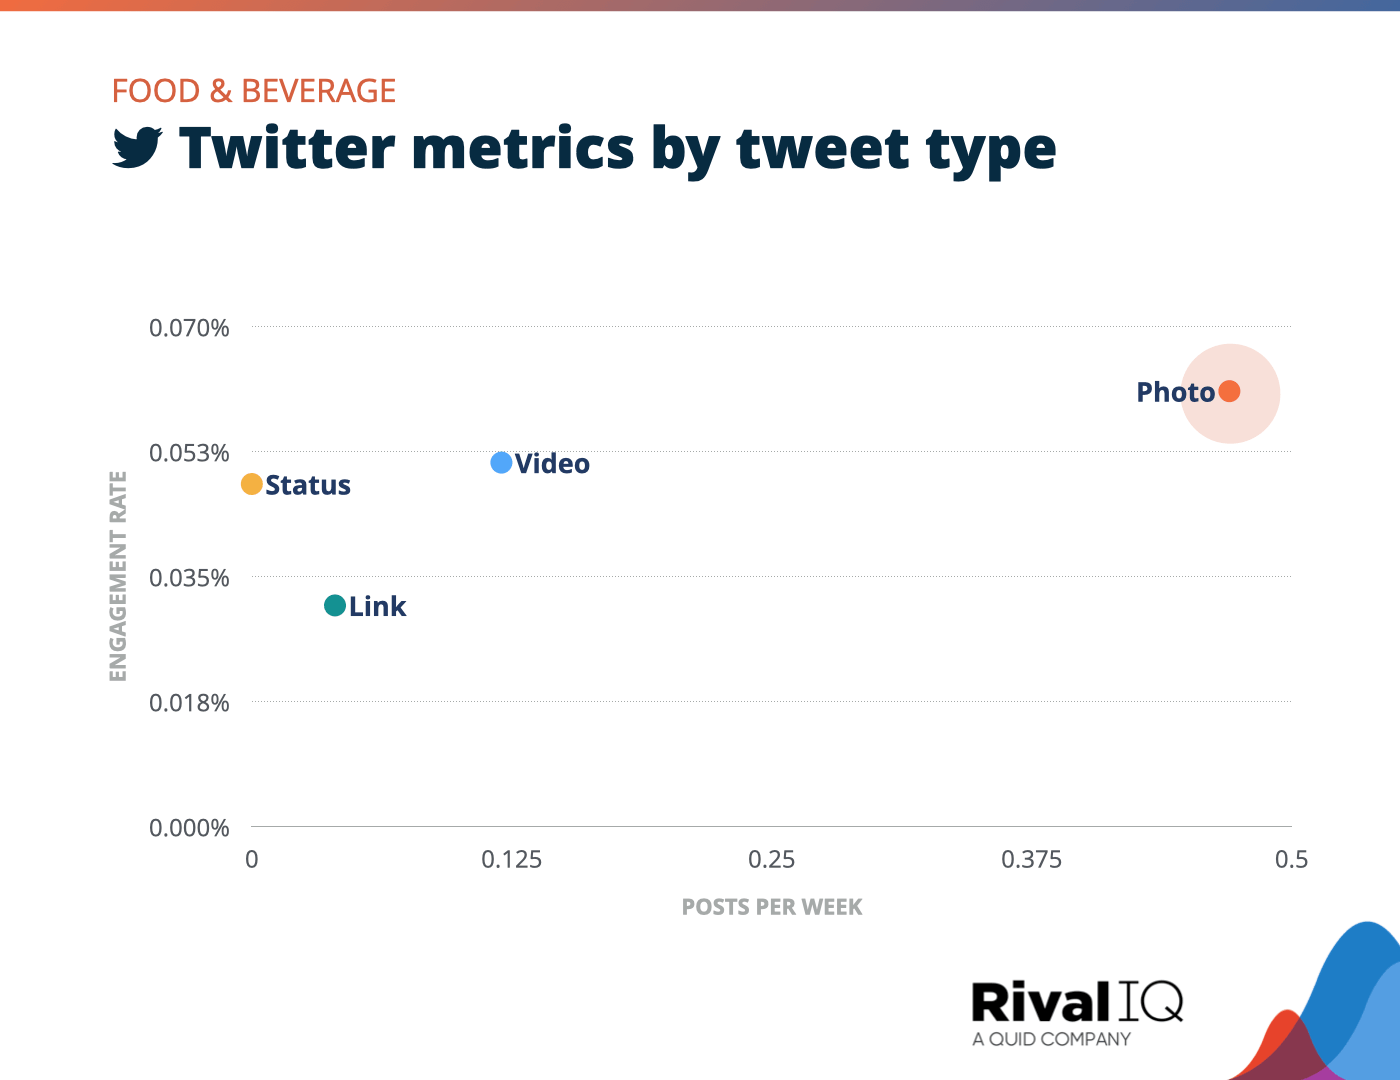
Twitter posts per week and engagement rate by tweet type, Food & Beverage
Photo tweets grabbed more engagement than any other type on Twitter this year for Food & Beverage brands.
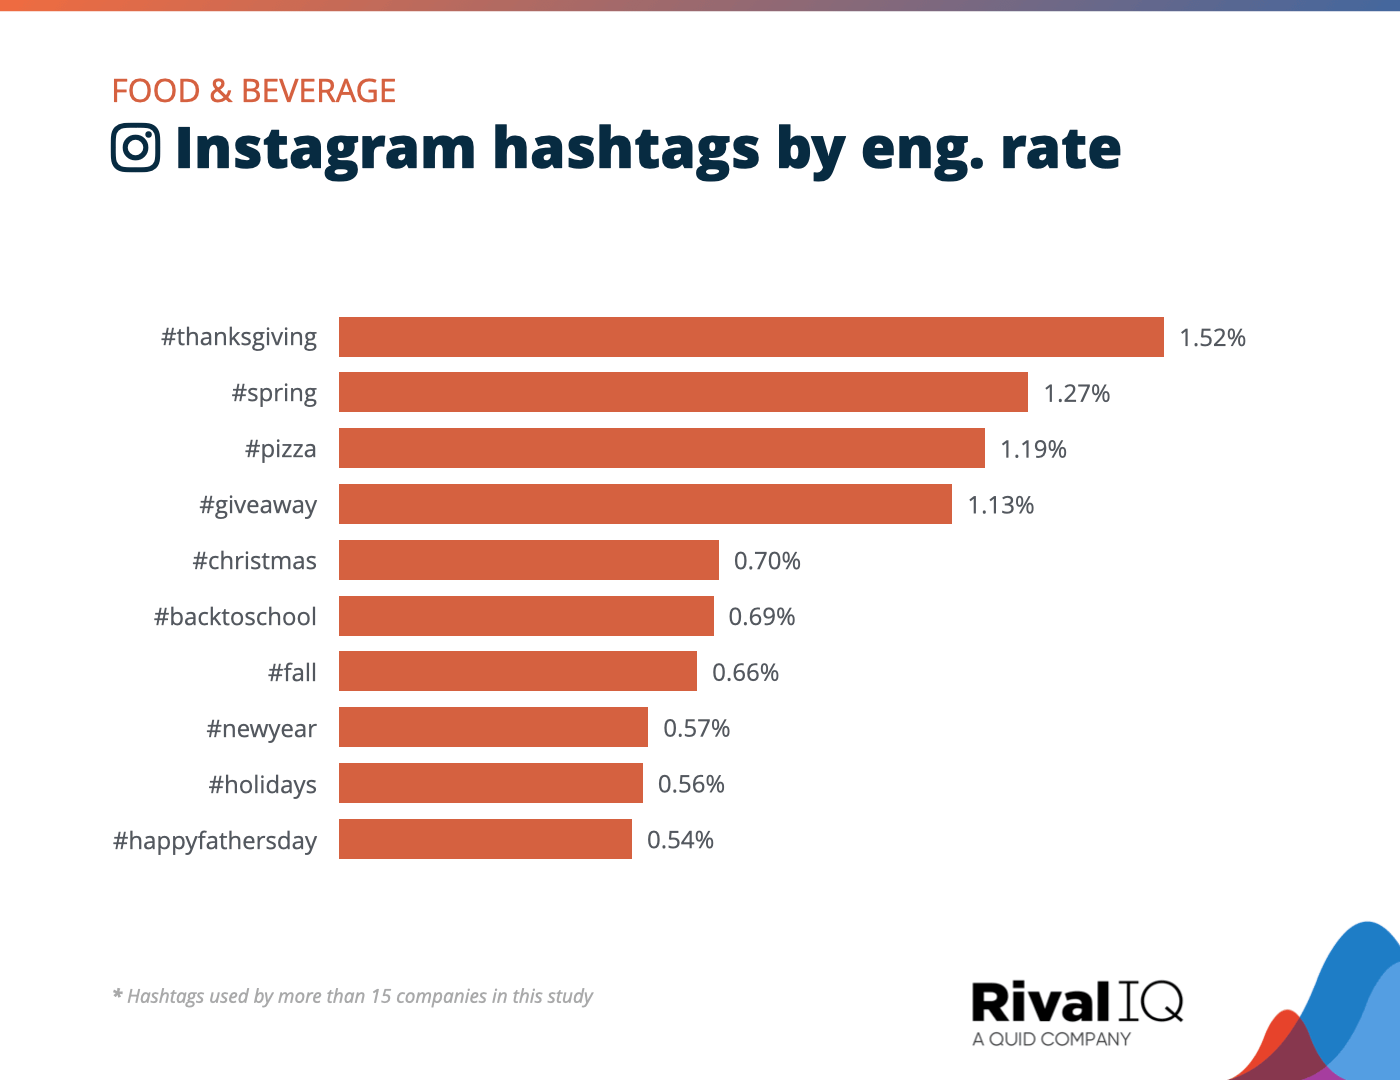
Top Instagram hashtags by engagement rate, Food & Beverage
Hashtags about food-focused holidays like #Thanksgiving and #Christmas won big for Food & Beverage brands on Instagram this year.
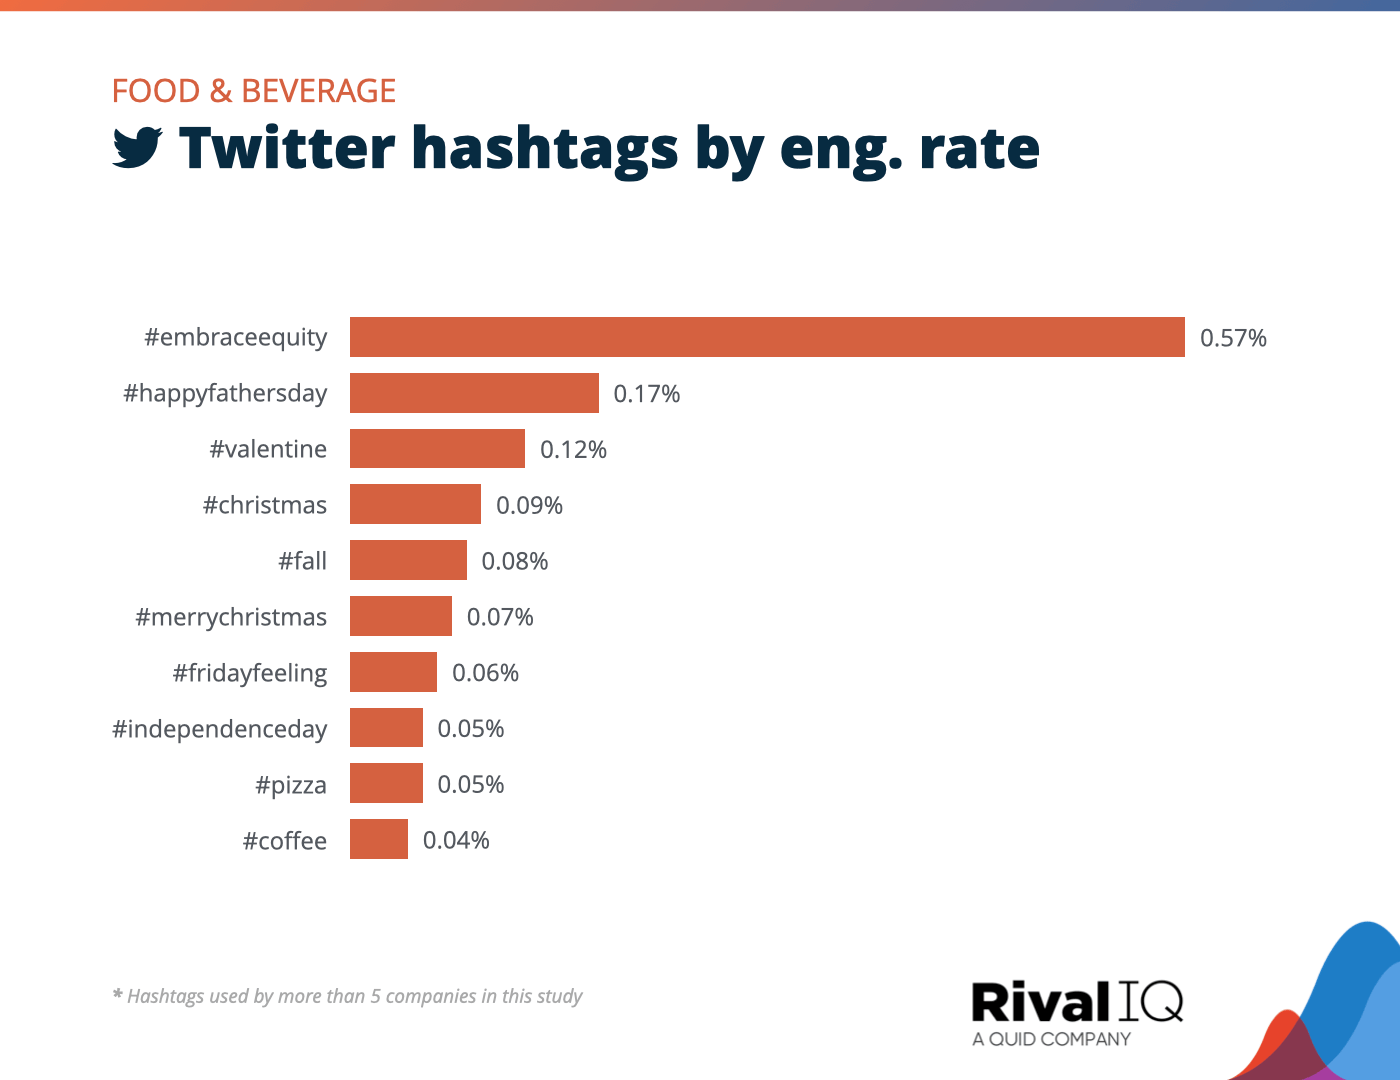
Top Twitter hashtags by engagement rate, Food & Beverage
The #EmbraceEquity hashtag performed more than three times better than the next most engaging hashtag on Twitter for Food & Beverage brands, proving followers care about social issues just as much as recipes.
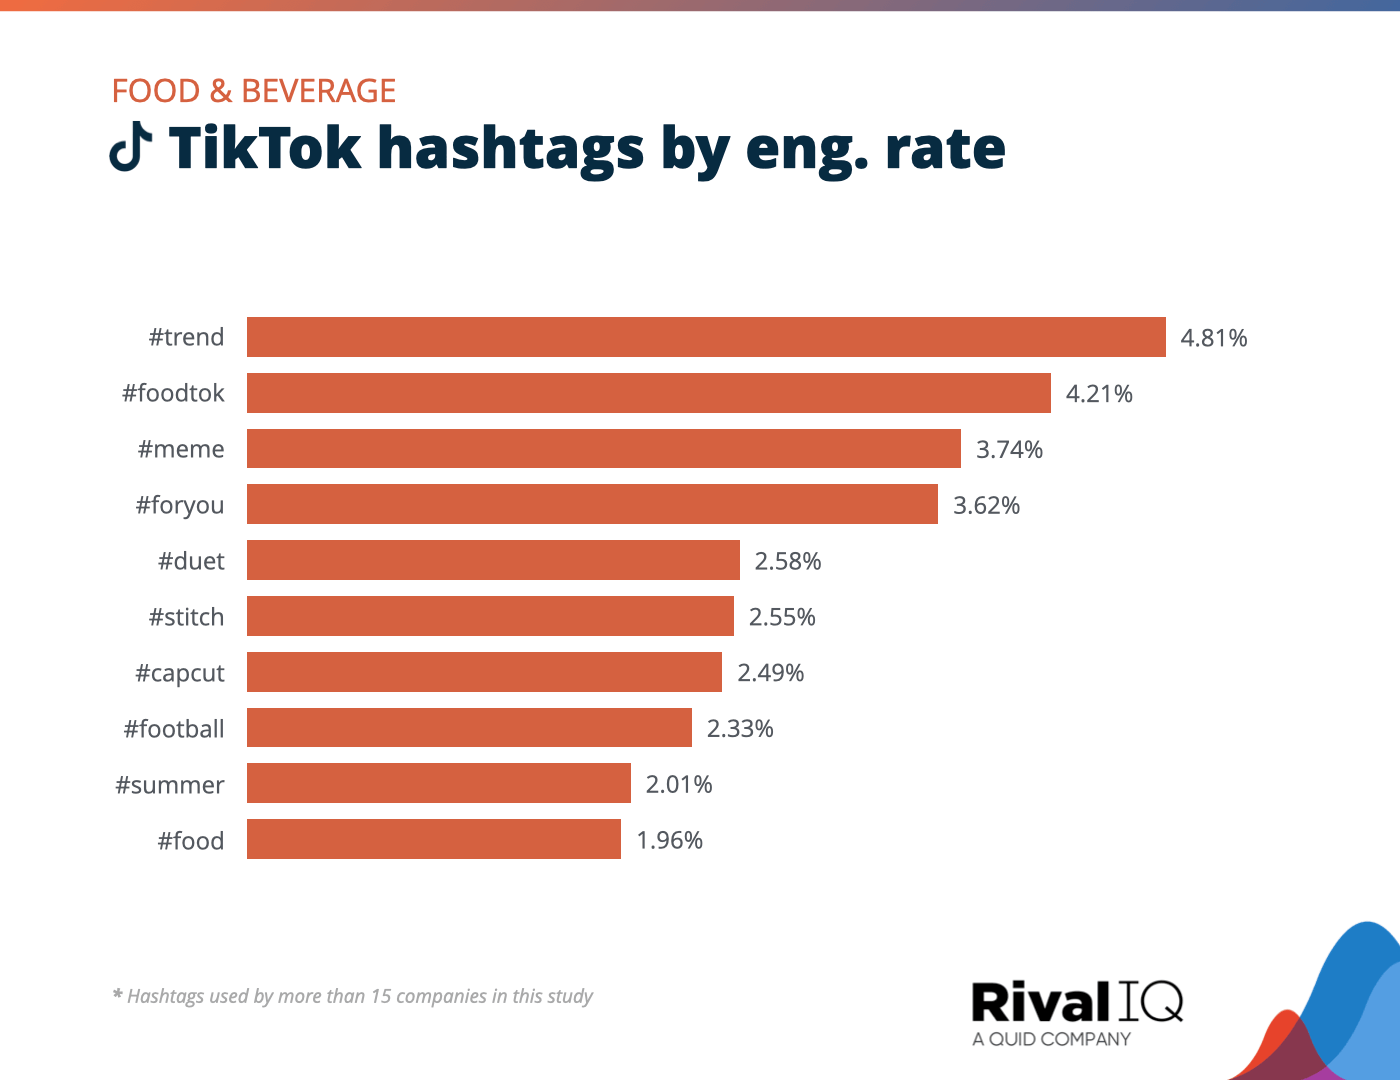
Top TikTok hashtags by engagement rate, Food & Beverage
Channel-themed hashtags like #trend and #meme helped attract more FYP eyeballs to Food & Beverage content on TikTok this year.
Health & Beauty Social Media Benchmarks
Health & Beauty brands struggled to engage fans and followers compared to their fellow industries, earning engagement rates far below the all-industry median across all four channels thanks in part to a saturated market.
A few growth ideas:
- Continue favoring TikTok and Instagram while keeping efforts low on Twitter, which doesn’t have much engagement payoff in this industry.
- Keep engaging fans with product releases and the next big trend in beauty.
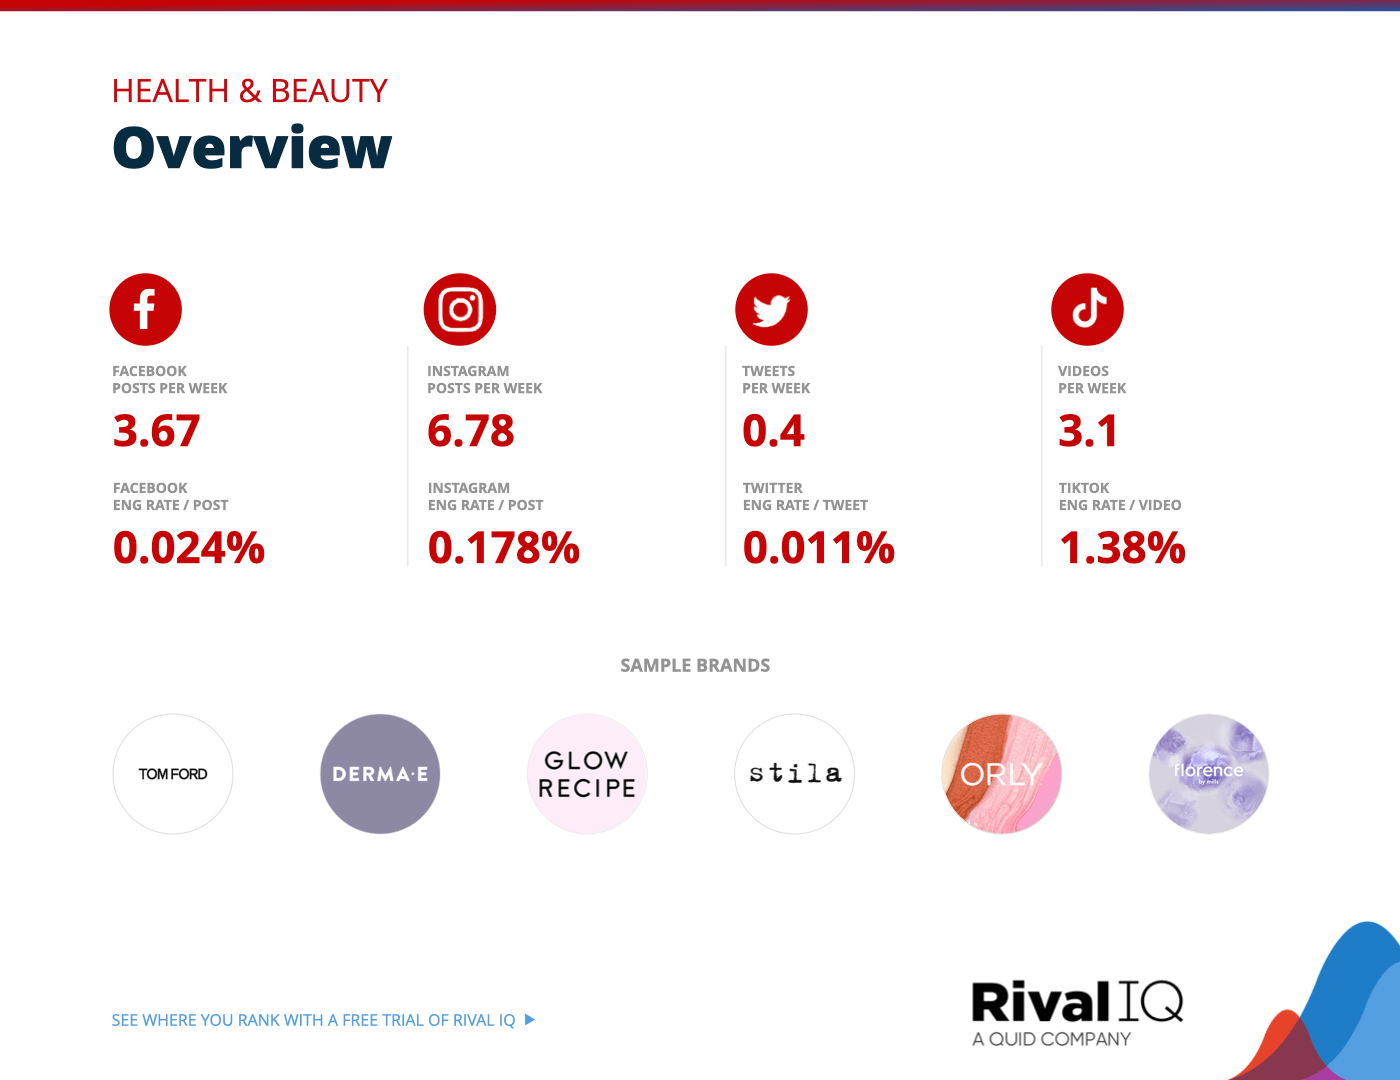
Overview of all benchmarks, Health & Beauty
Notable brands in this year’s report include Derma E, Florence By Mills, Glow Recipe, ORLY, Stila, and Tom Ford Beauty.
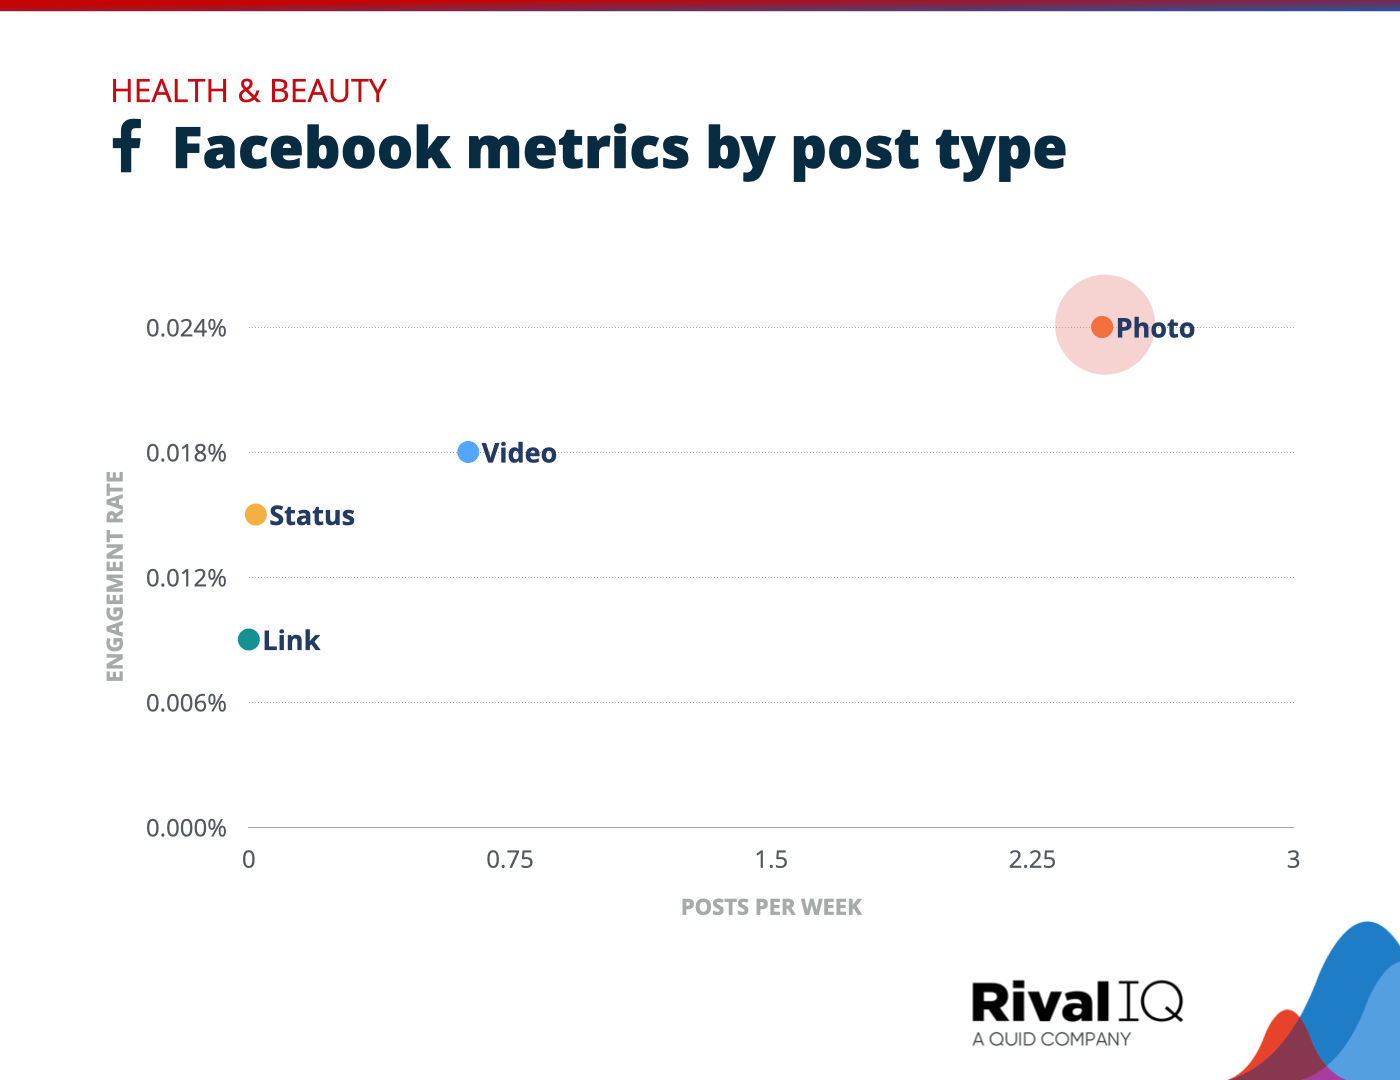
Facebook posts per week and engagement rate by post type, Health & Beauty
Image-based post types performed twice as well for Health & Beauty brands as text-heavy links and status updates.
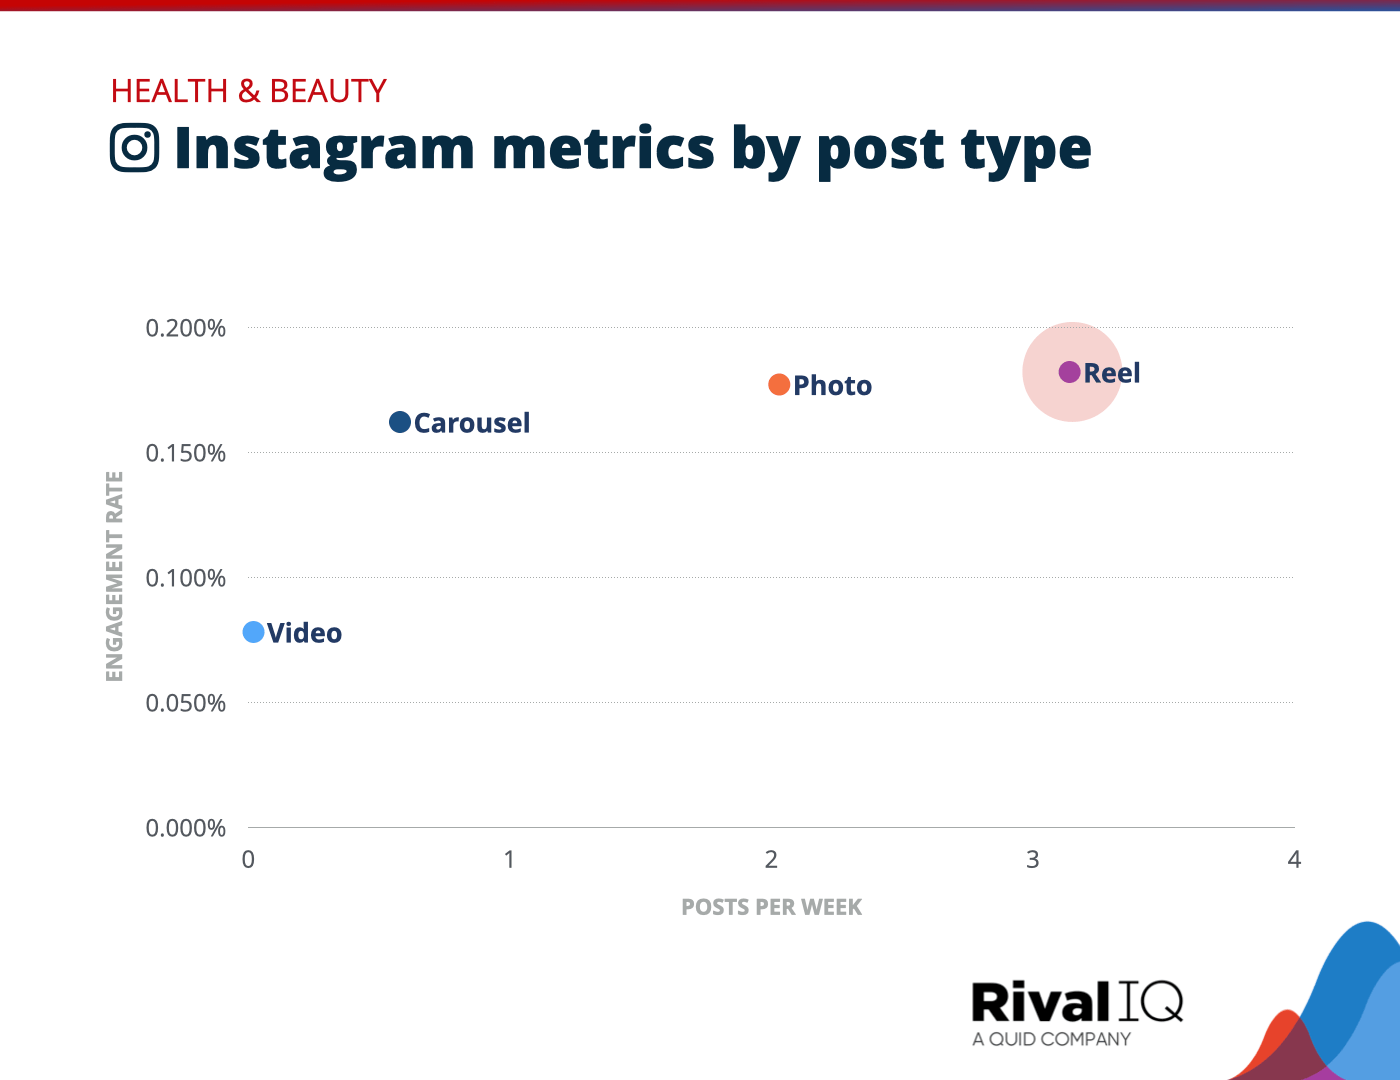
Instagram posts per week and engagement rate by post type, Health & Beauty
Health & Beauty brands doubled their rate of Reels per week this year, which paid off with strong engagement for that post type.
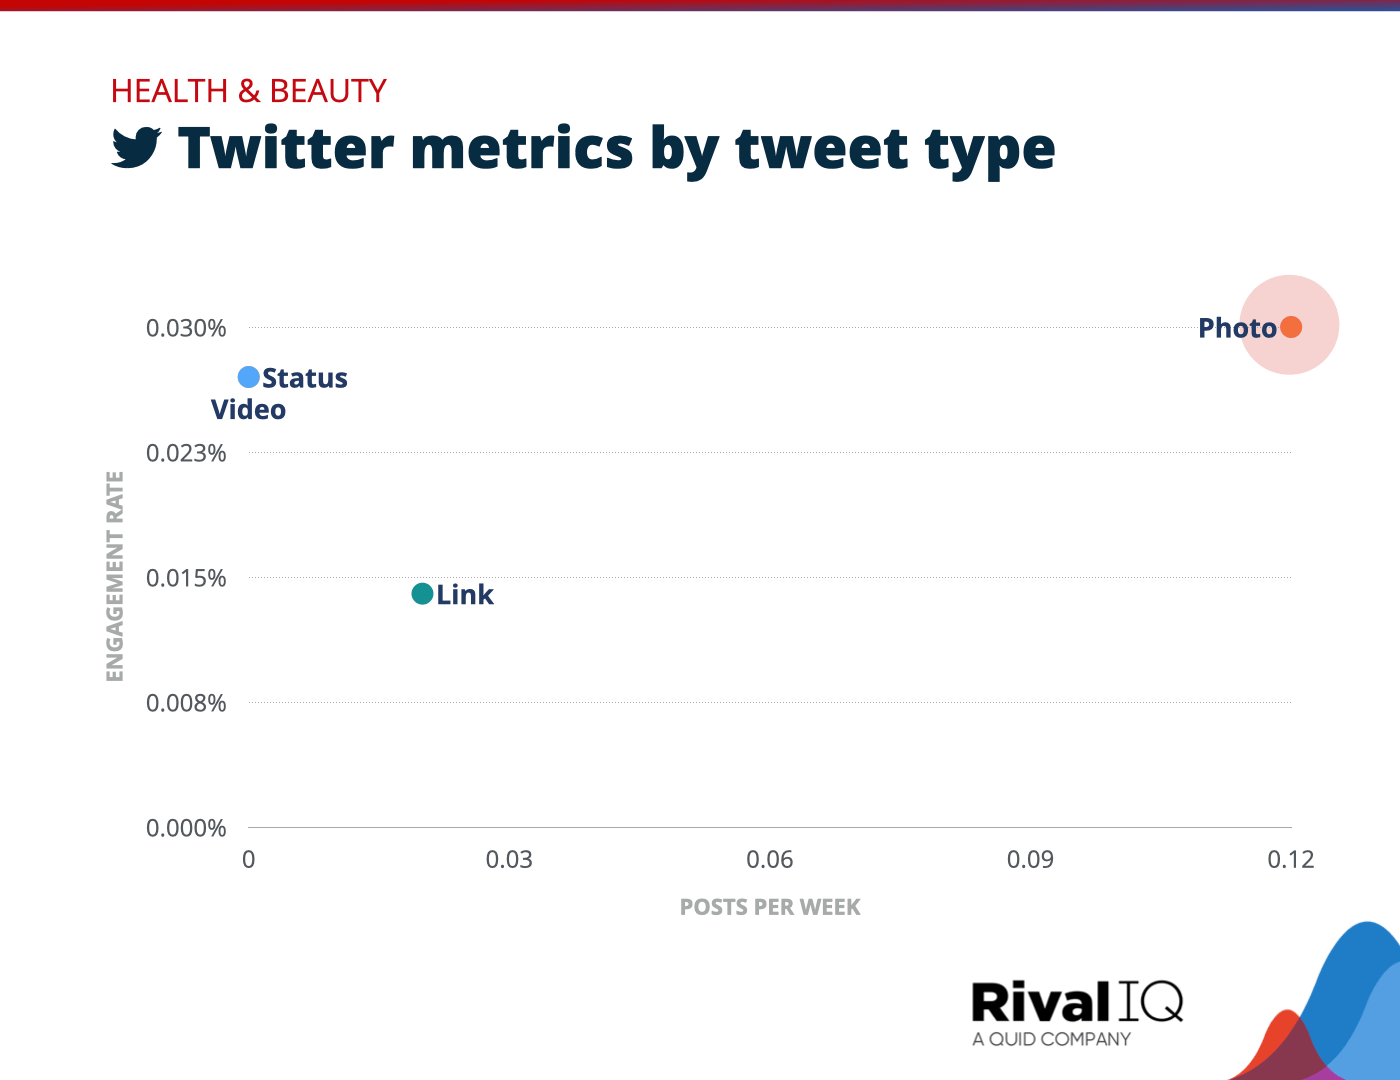
Twitter posts per week and engagement rate by tweet type, Health & Beauty
Health & Beauty brands tweeted less than ever this year, but were more likely to post a photo than any other tweet type.
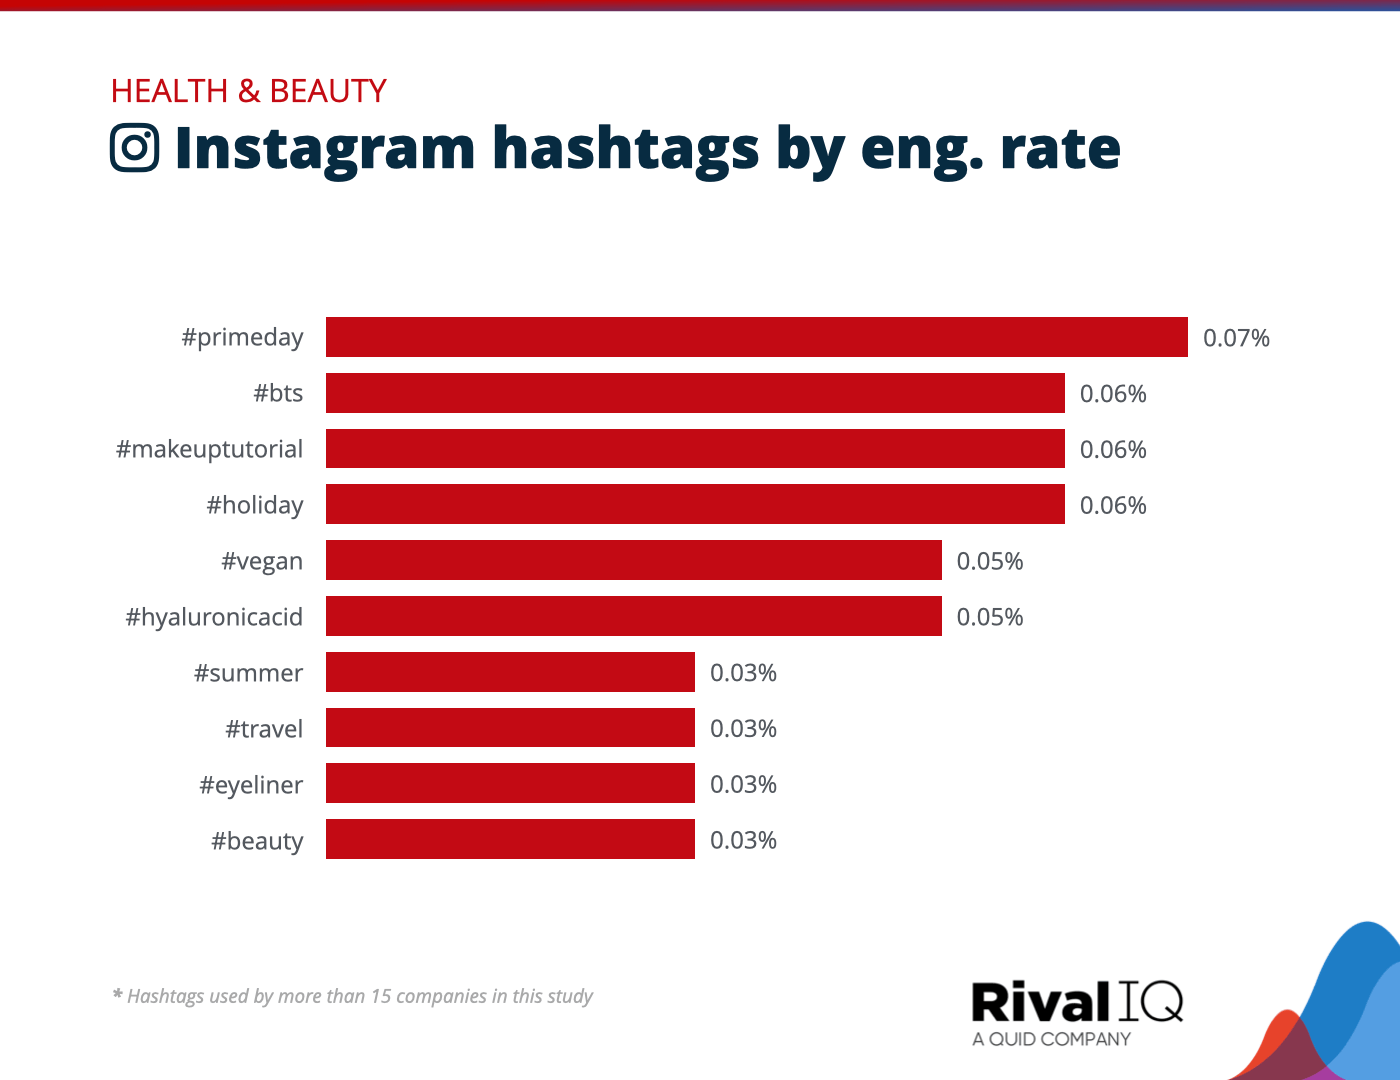
Top Instagram hashtags by engagement rate, Health & Beauty
Reminding followers to scoop up big deals with the #PrimeDay hashtag worked well for Health & Beauty brands on Instagram this year, as did tutorial and behind-the-scenes hashtags.
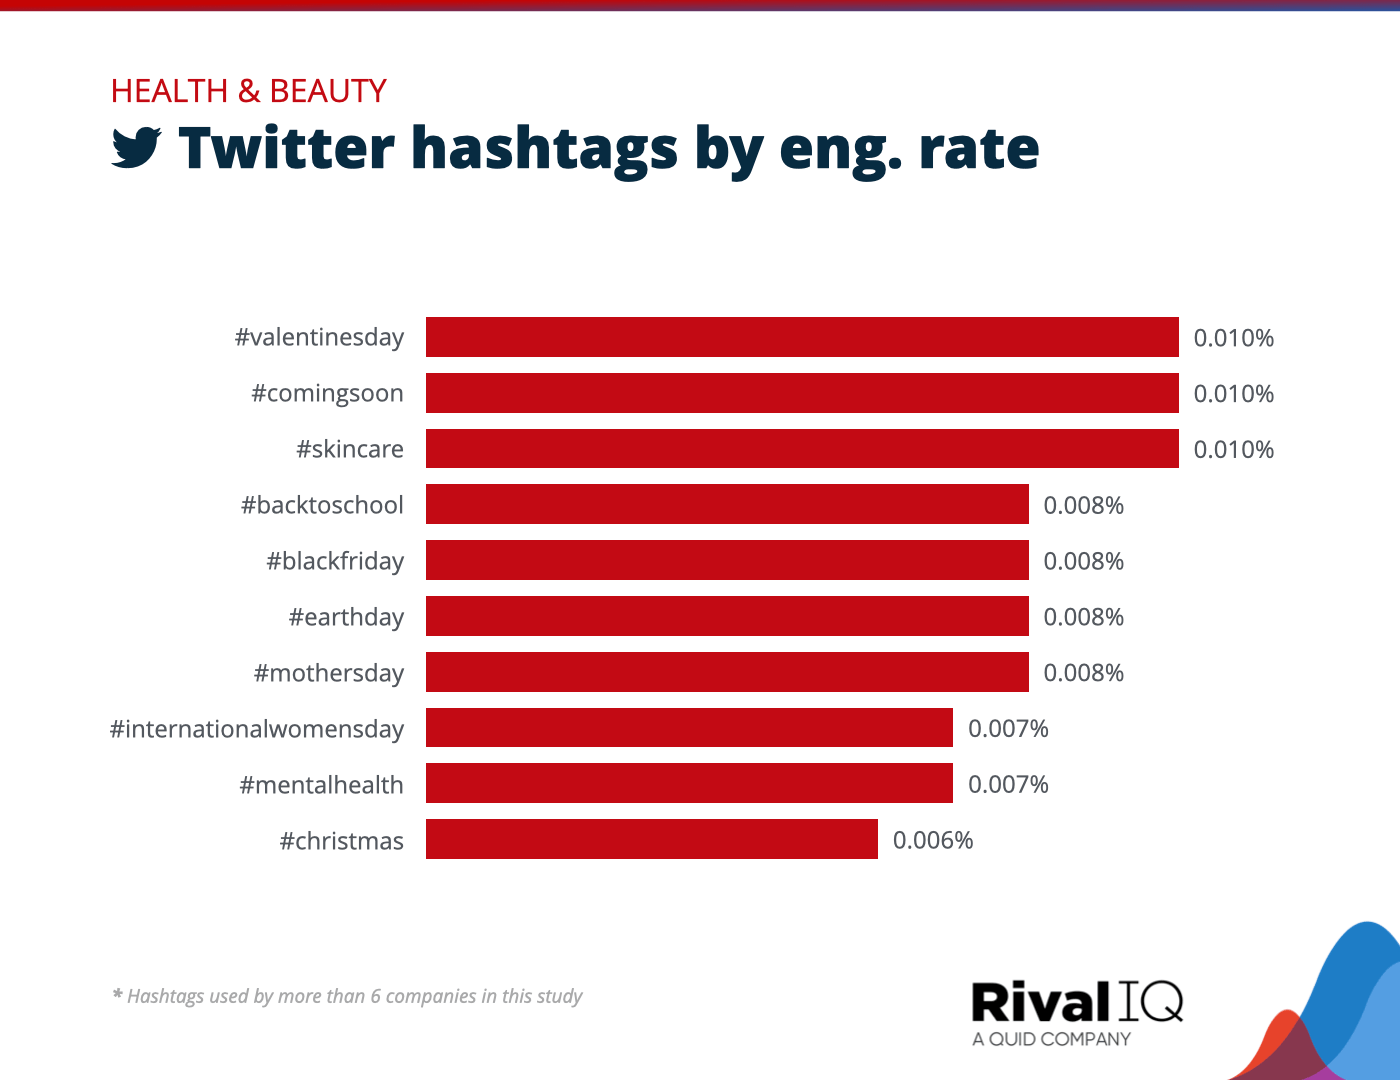
Top Twitter hashtags by engagement rate, Health & Beauty
Hashtags didn’t do much for Health & Beauty brands on Twitter this year, but holiday mentions helped remind followers about shopping opportunities.
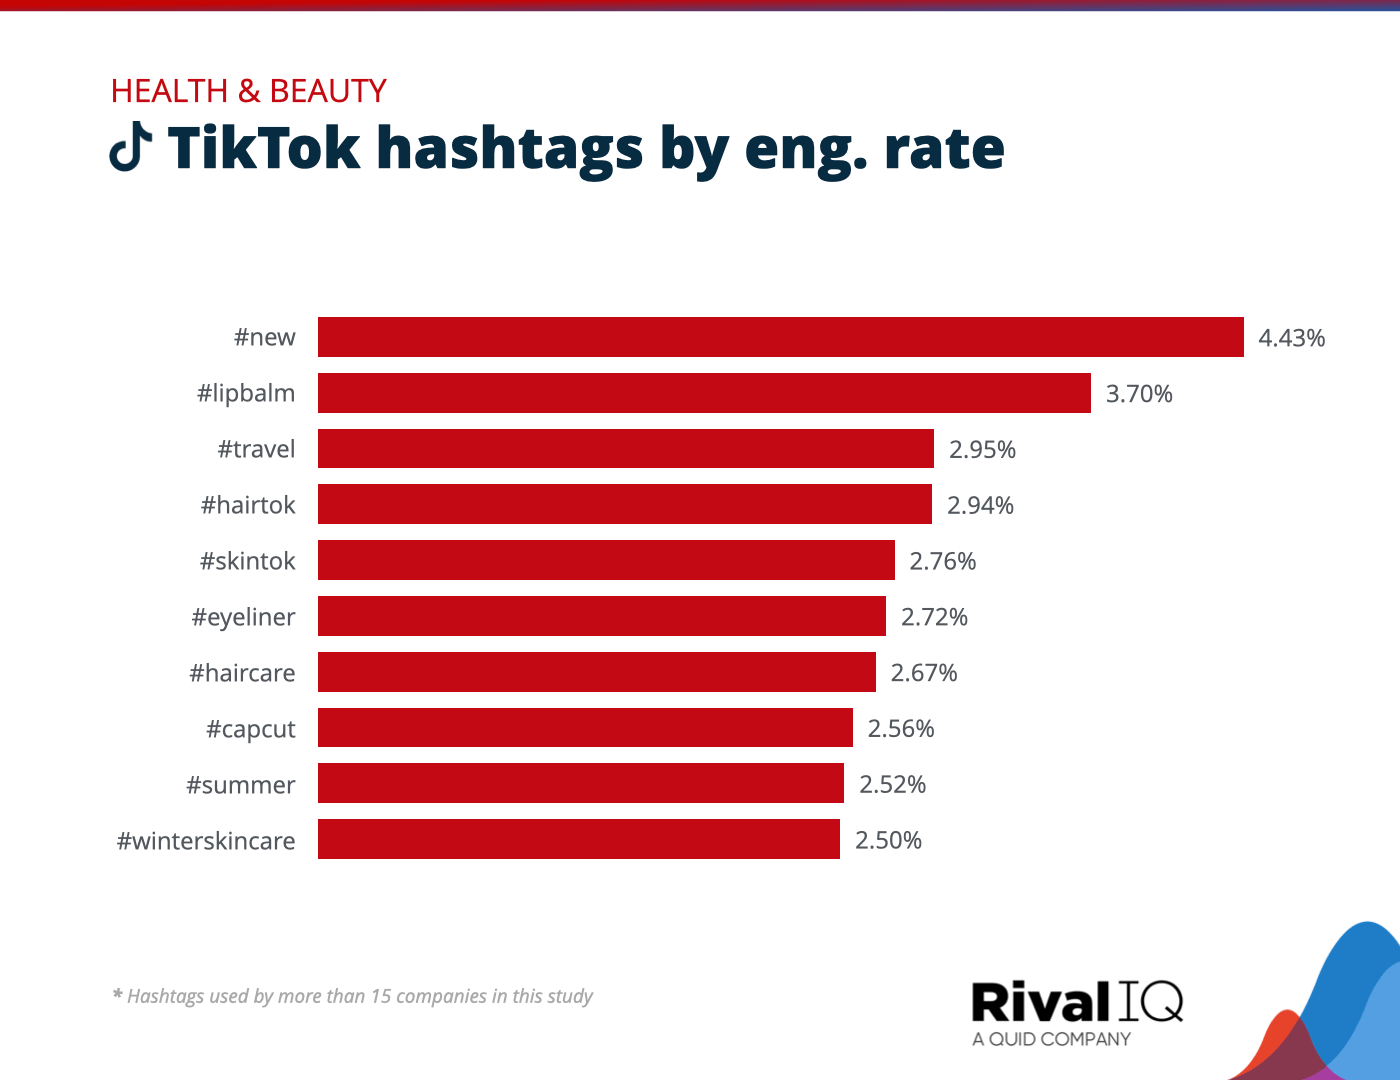
Top TikTok hashtags by engagement rate, Health & Beauty
Health & Beauty brands ate up the chance to introduce the next big product release to followers with the #new hashtag, and also favored #HairTok and #SkinTok hashtags that helped users find tutorials and how-tos.
Higher Ed Social Media Benchmarks
Higher Ed is investing more in social than ever and reaping the benefits: colleges and universities were the most engaging industry on Instagram and TikTok, and the second most engaging on Facebook and Twitter.
For even higher Higher Ed engagement rates:
- Continue investing in video content like TikToks and Reels.
- Followers love posts hashtagged with campus activities like #OpeningWeek or #MoveInDay.
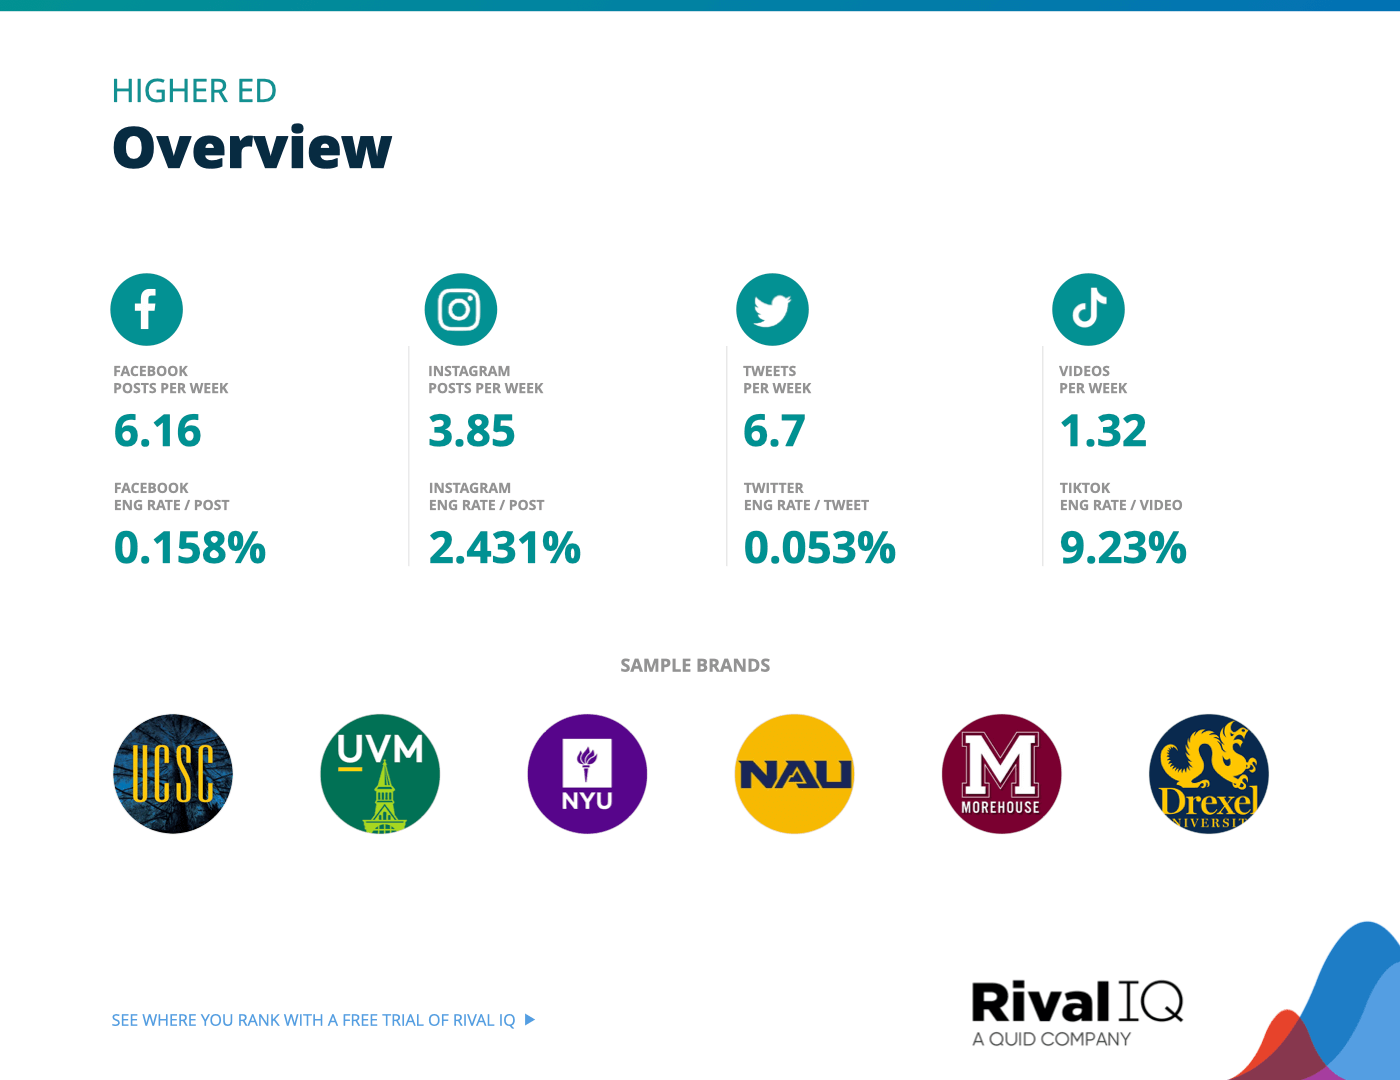
Overview of all benchmarks, Higher Ed
Notable brands in this year’s report include Drexel University, Morehouse College, Northern Arizona University, New York University, University of California at Santa Cruz, and University of Vermont.
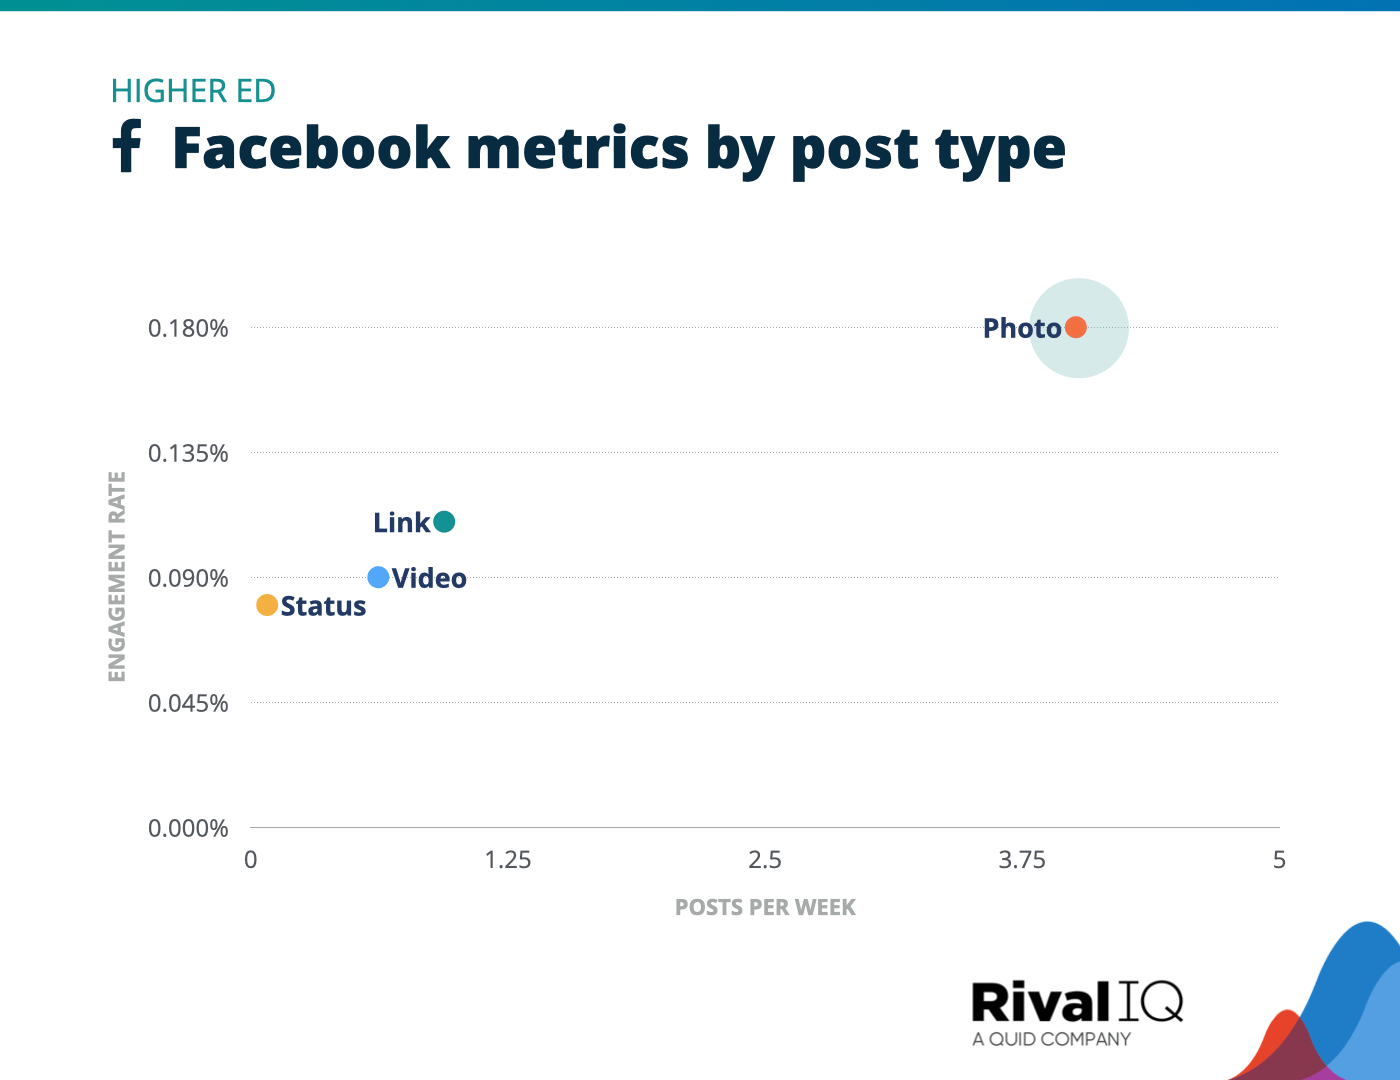
Facebook posts per week and engagement rate by post type, Higher Ed
Photo posts dominated the engagement charts for Higher Ed this year, with links to content and campus news coming in a distant second.
Cedarville University used carousels to beat out their rivals on Instagram this year.
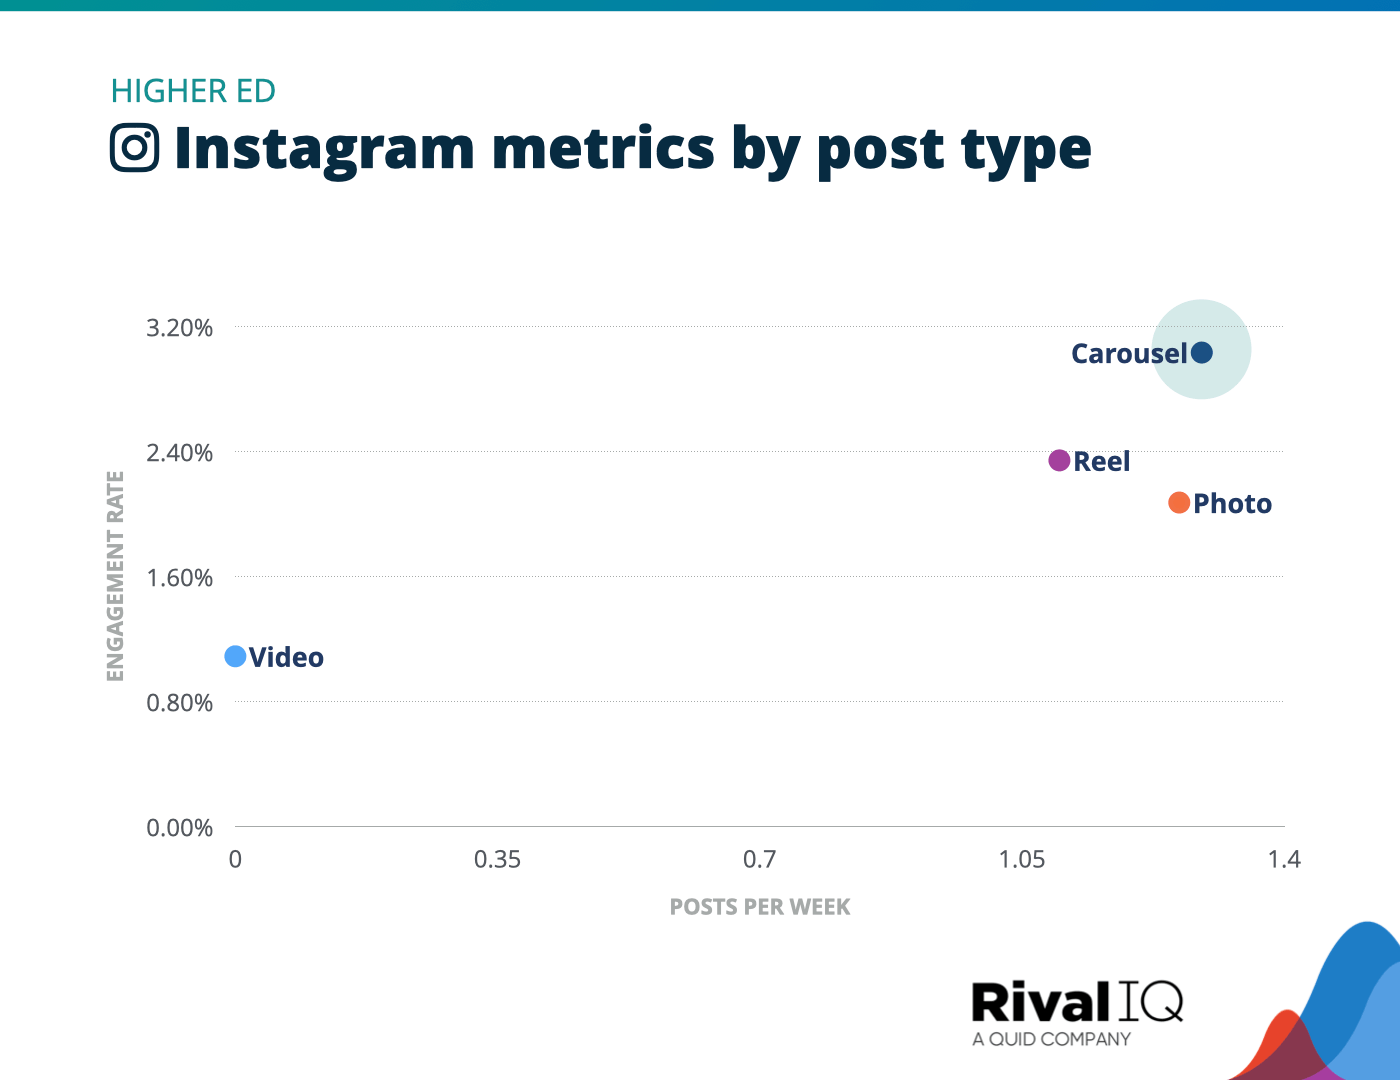
Instagram posts per week and engagement rate by post type, Higher Ed
Carousel posts soared for schools on Instagram this year, but Reels weren’t far behind as Higher Ed continued to reinvest energy normally spent on videos.
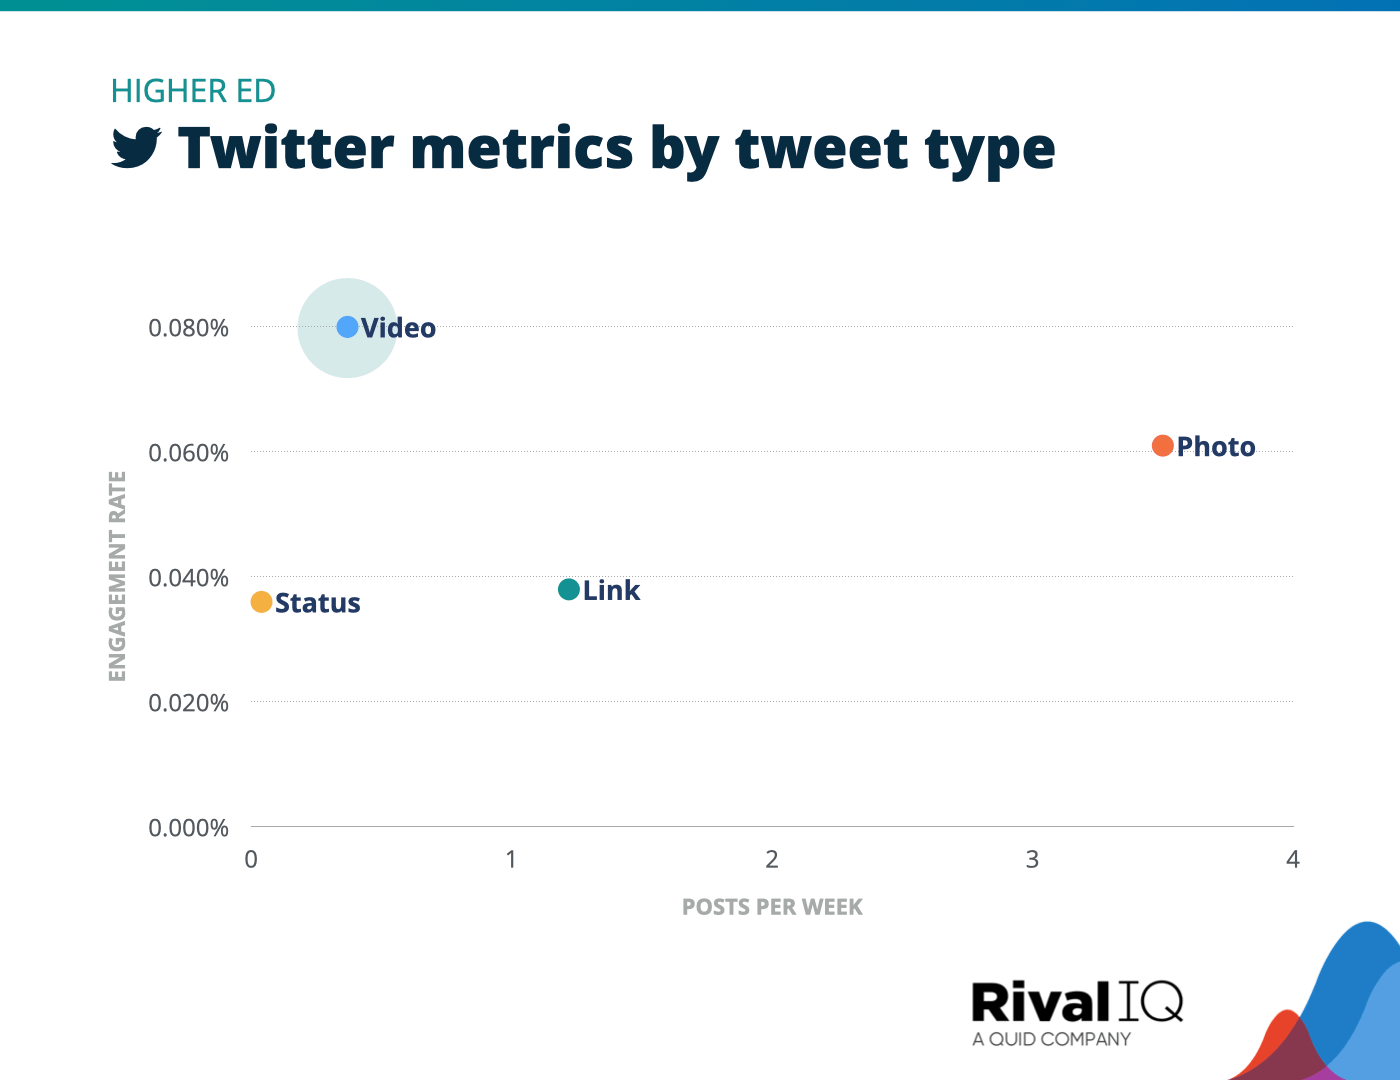
Twitter posts per week and engagement rate by tweet type, Higher Ed
Video tweets topped the charts for Higher Ed on Twitter this year, but these colleges and universities were 3x more likely to tweet a photo.
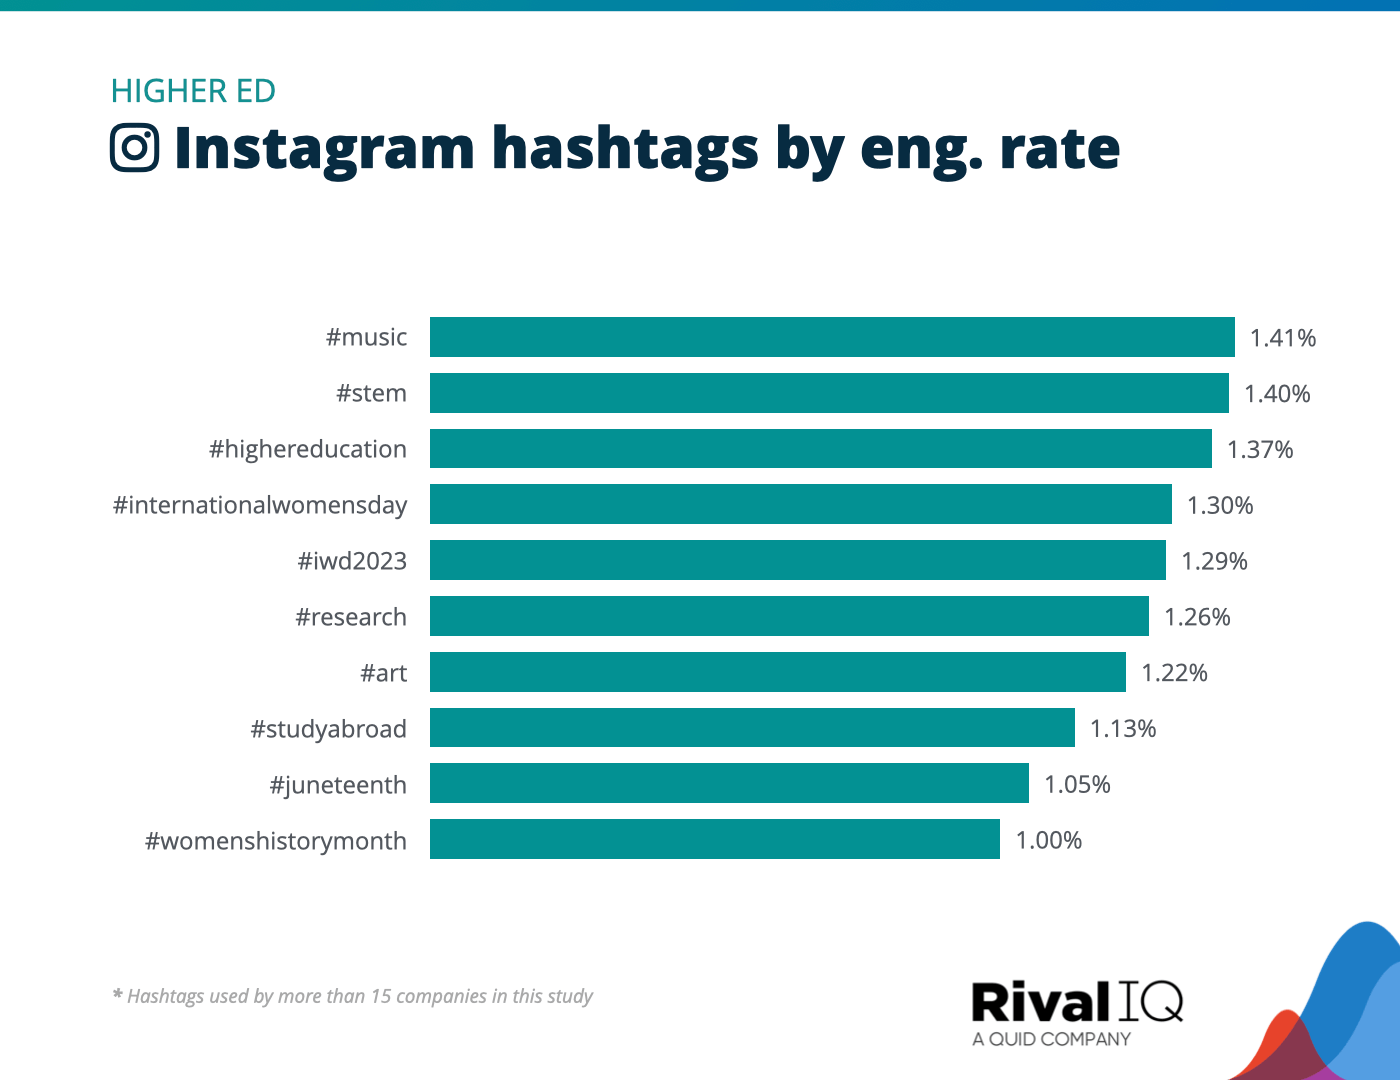
Top Instagram hashtags by engagement rate, Higher Ed
School-focused hashtags like #STEM, #research, and #StudyAbroad were big winners for Higher Ed on Instagram this year.
It’s worth noting that these hashtag engagement rates were about 4x higher last year, indicating that hashtags don’t get you as far as they used to.
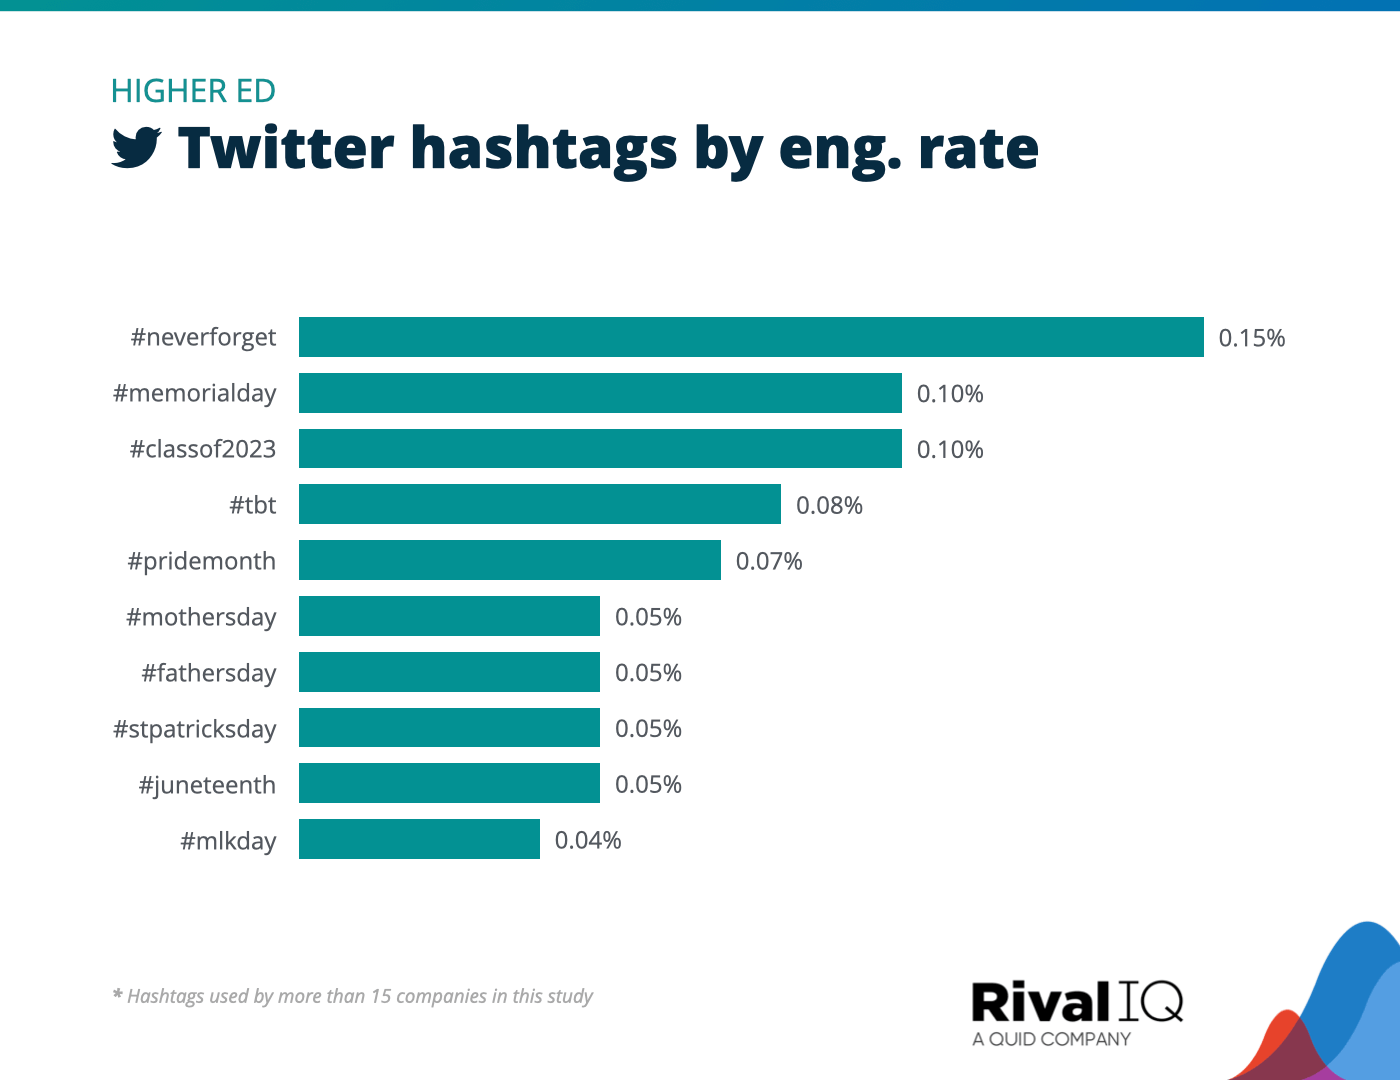
Top Twitter hashtags by engagement rate, Higher Ed
Colleges and universities were all about holiday-themed hashtags on Twitter this year.
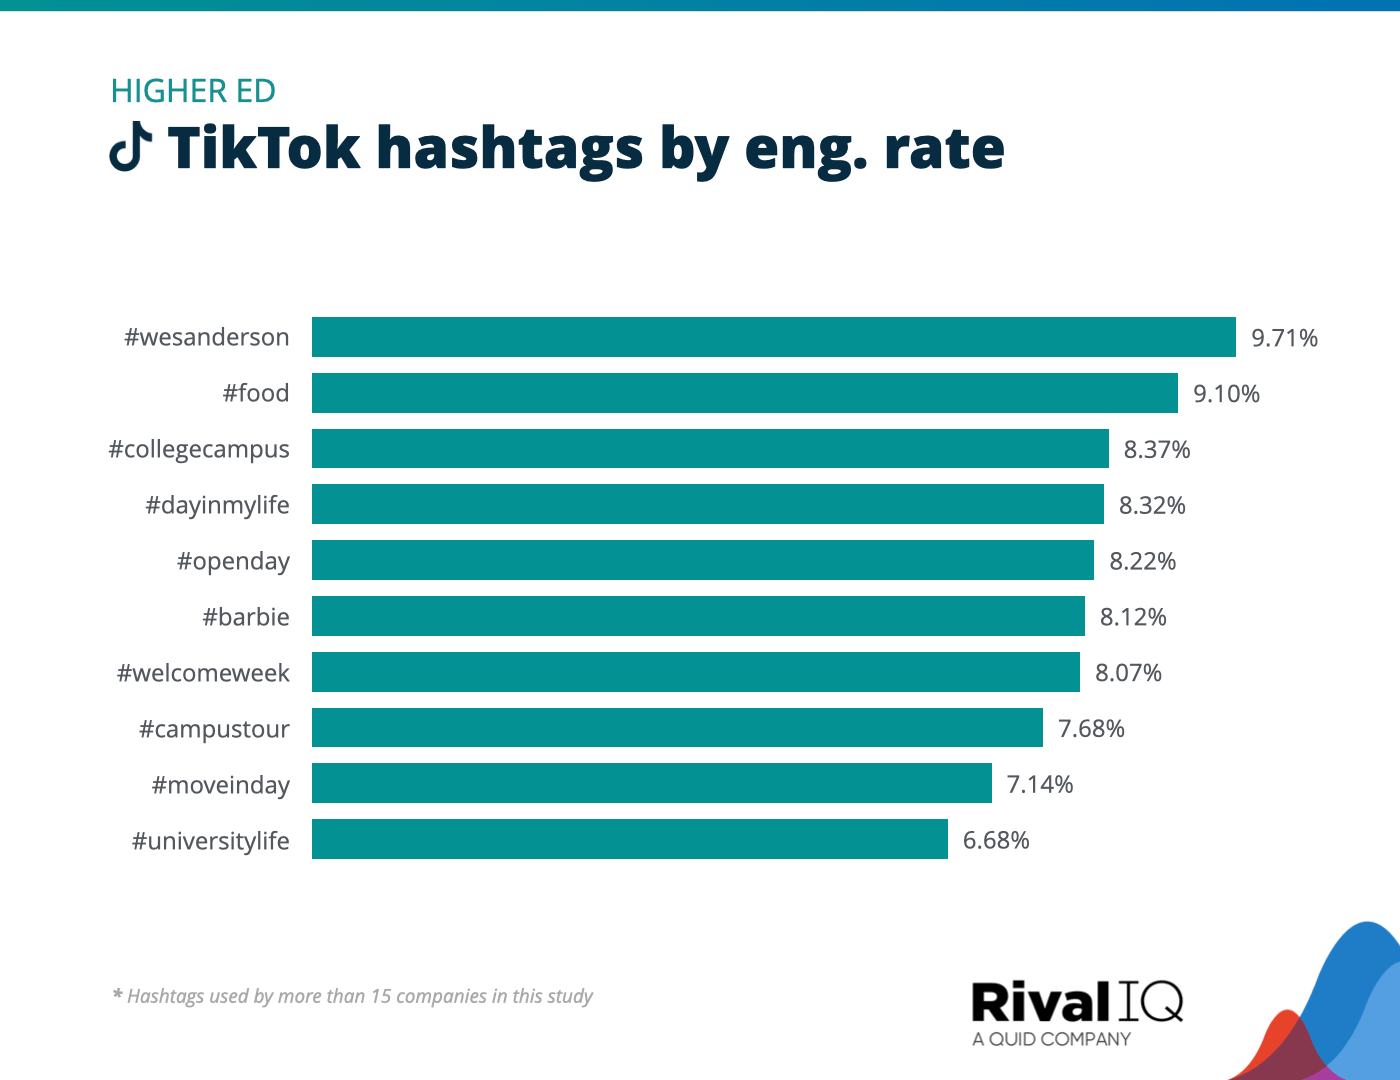
Top TikTok hashtags by engagement rate, Higher Ed
The #WesAnderson video trend grabbed a ton of attention from Higher Ed fans on TikTok, as did more campus-themed hashtags like #WelcomeWeek and #MoveInDay.
Hungry for more benchmarking? We’ve got the definitive guide to all things Instagram Stories.
Grab the guideHome Decor Social Media Benchmarks
Home Decor brands earned engagement rates towards the bottom of the pack on all channels, but they did manage to increase or stay flat compared to last year, which is no small feat in these changing times.
Some ideas for increasing engagement:
- Industry-themed hashtags helped followers find Home Decor content, so keep those up.
- Photos and Reels are the way to go on most channels.
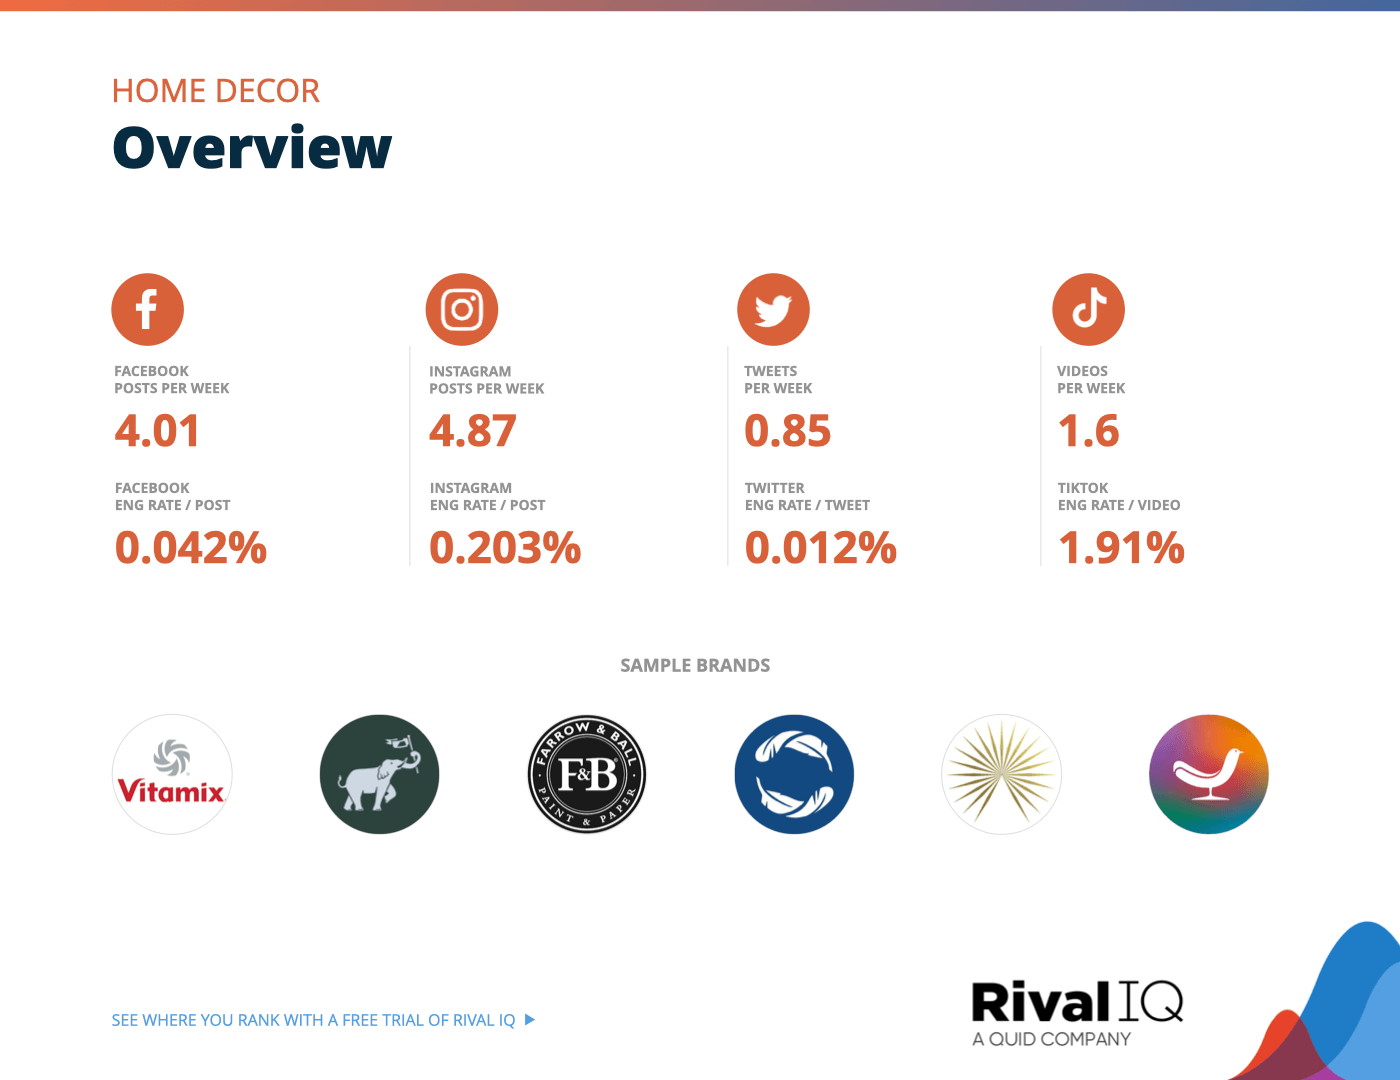
Overview of all benchmarks, Home Decor
Notable brands in this year’s report include Arteriors, The Company Store, Farrow and Ball, Joybird, One Kings Lane, and Vitamix.
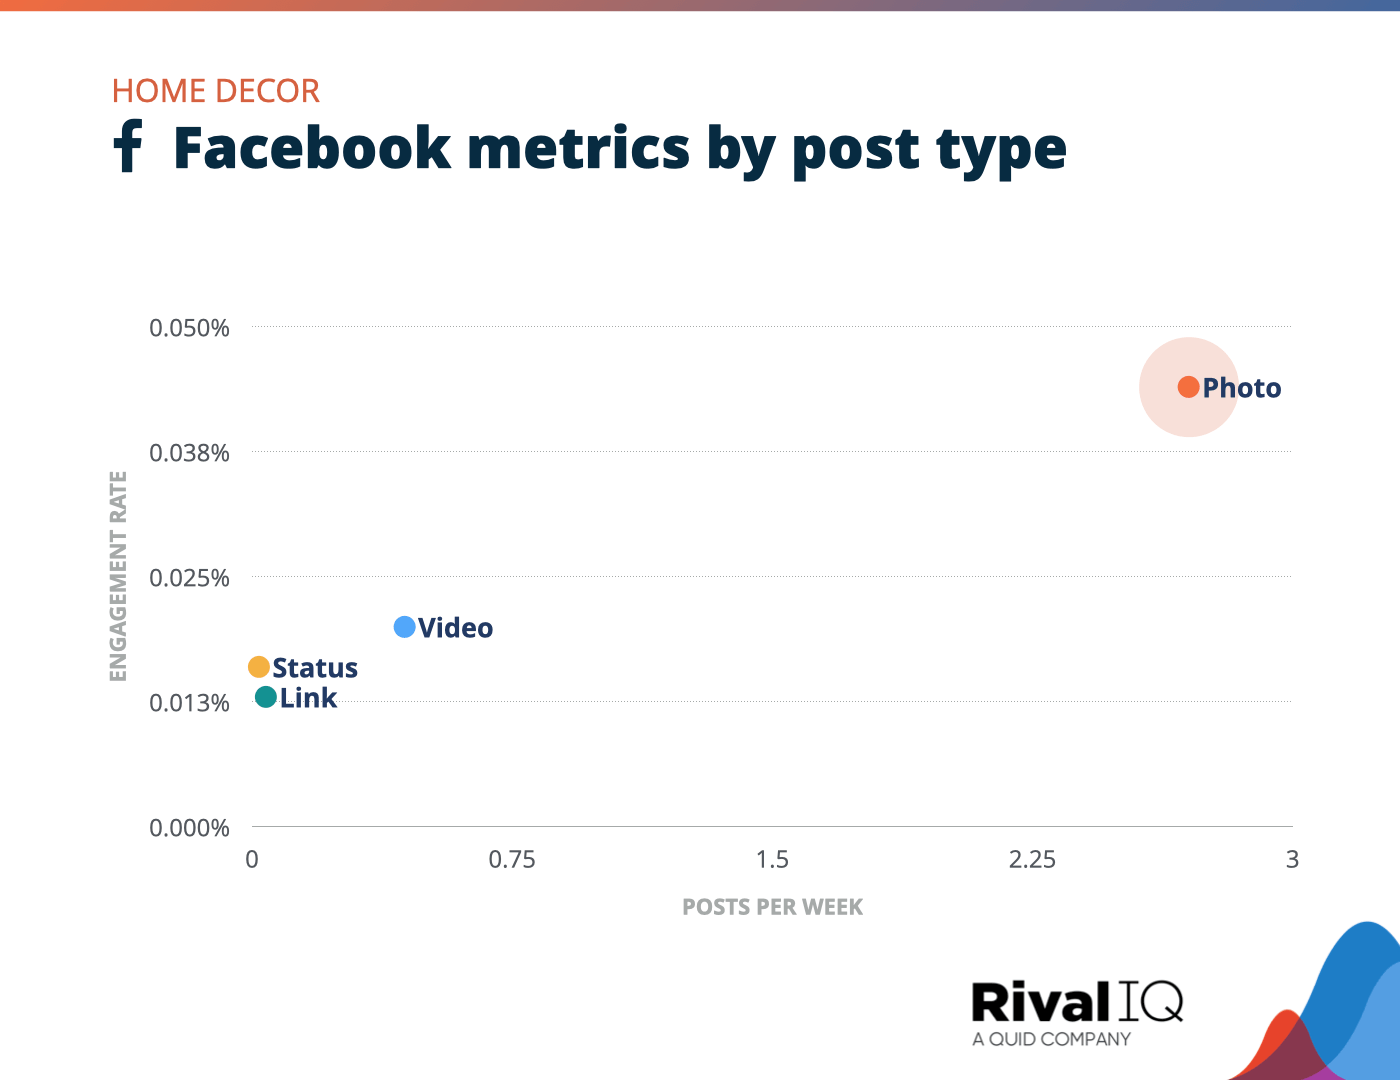
Facebook posts per week and engagement rate by post type, Home Decor
Home Decor brands were way likelier to post a photo on Facebook than any other post type, which is a smart move, since photos grabbed much higher engagement rates.
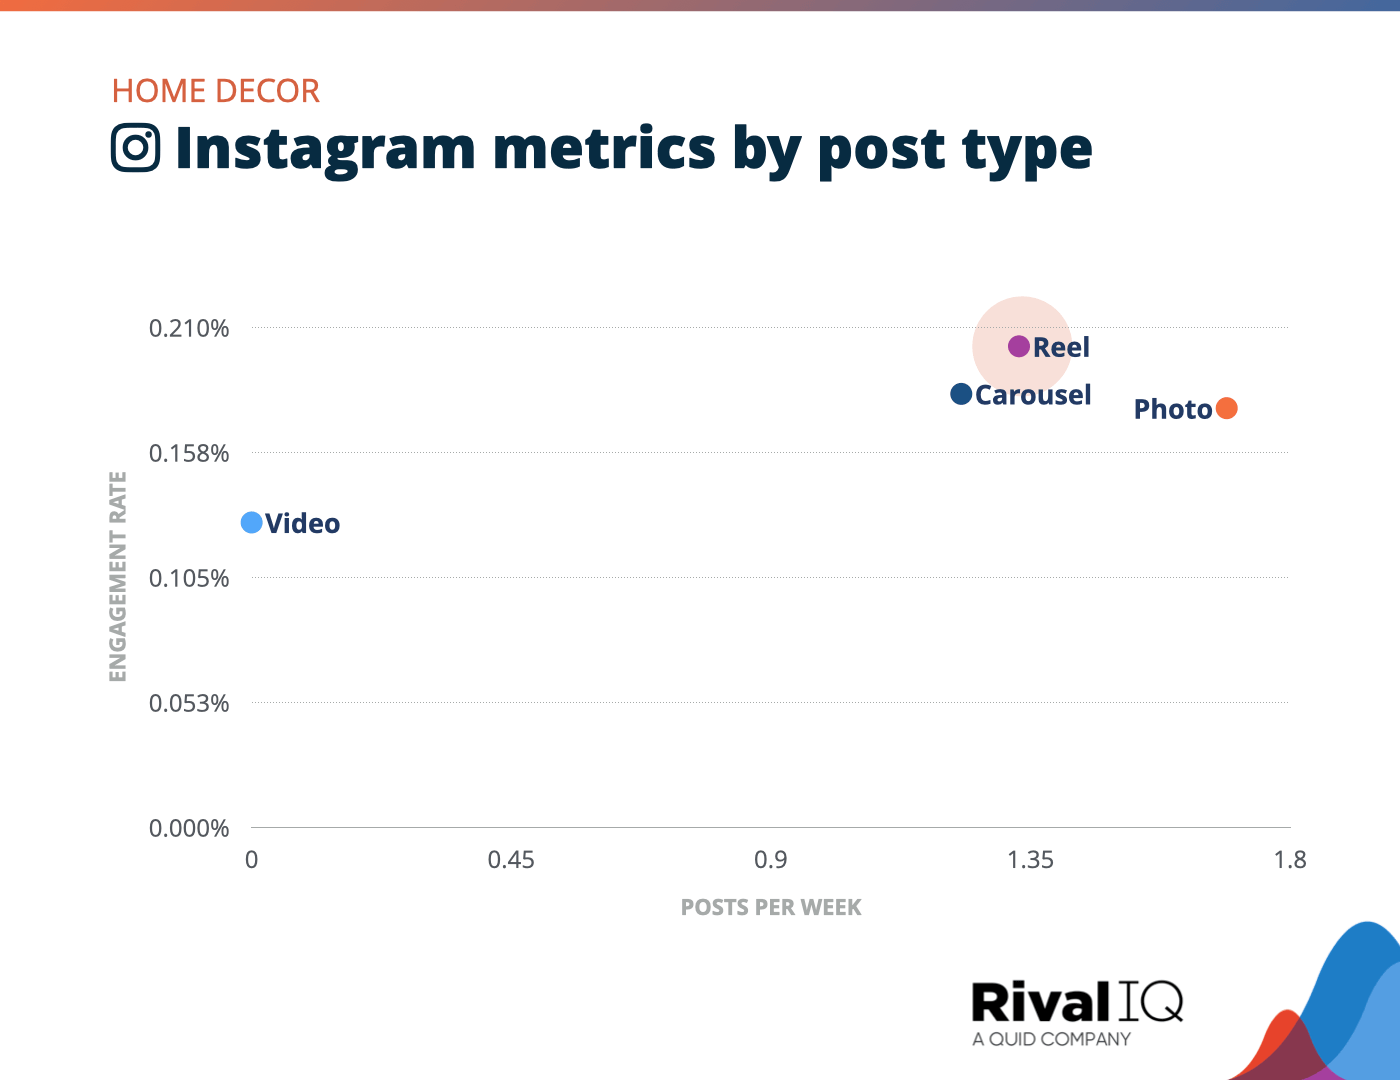
Instagram posts per week and engagement rate by post type, Home Decor
Home Decor brands left video behind in a big way this year in favor of Reels, which paid off with the highest engagement rates of any post type.
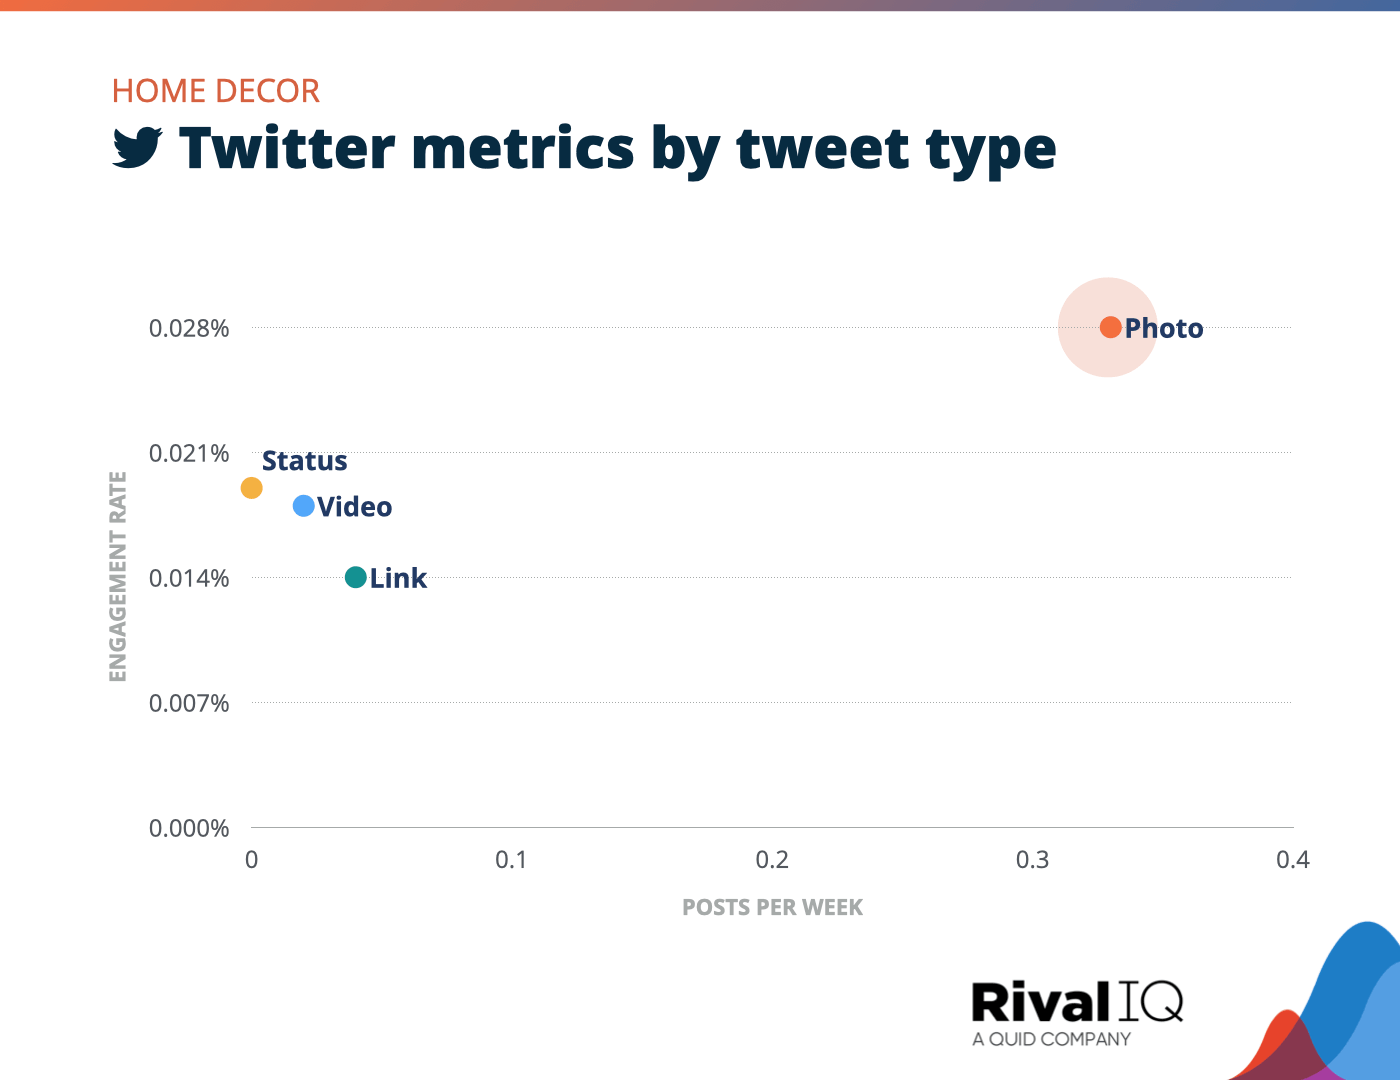
Twitter posts per week and engagement rate by tweet type, Home Decor
Photo tweets were where it’s at on Twitter this year for Home Decor brands measured by both engagement rate and frequency.
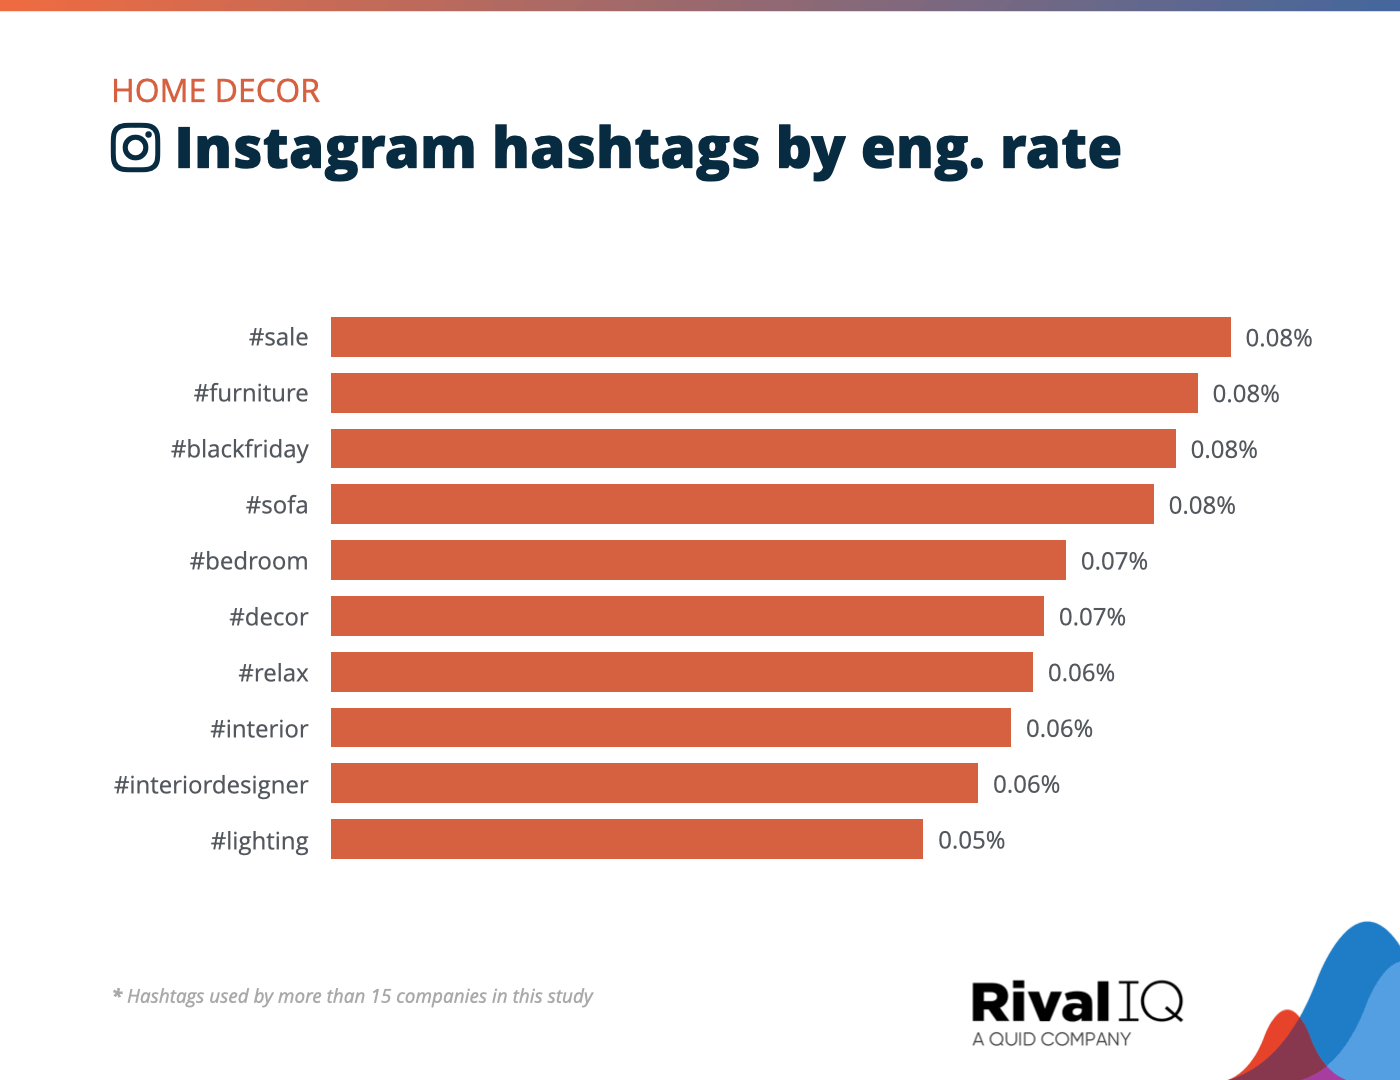
Top Instagram hashtags by engagement rate, Home Decor
Home Decor brands kept it in the family with their top-performing hashtags on Instagram this year. From #furniture to #decor to #InteriorDesigner, followers could expect home-themed hashtags from their favorite brands.
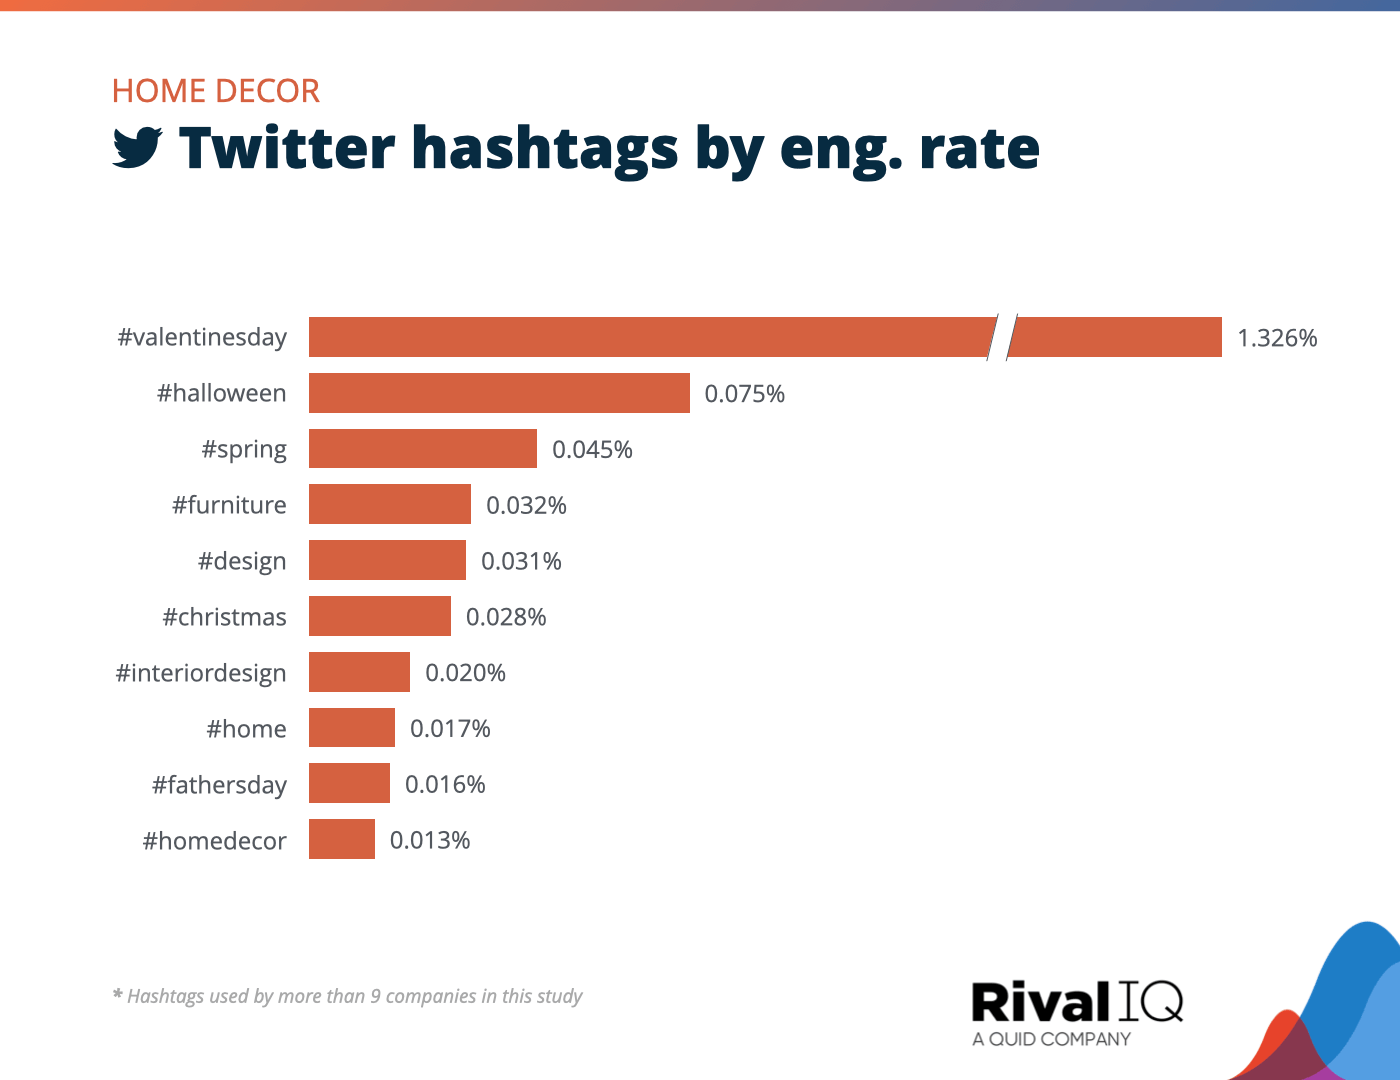
Top Twitter hashtags by engagement rate, Home Decor
Valentine’s Day tweets outpaced other Home Decor hashtags on Twitter by a mile for Home Decor brands this year.
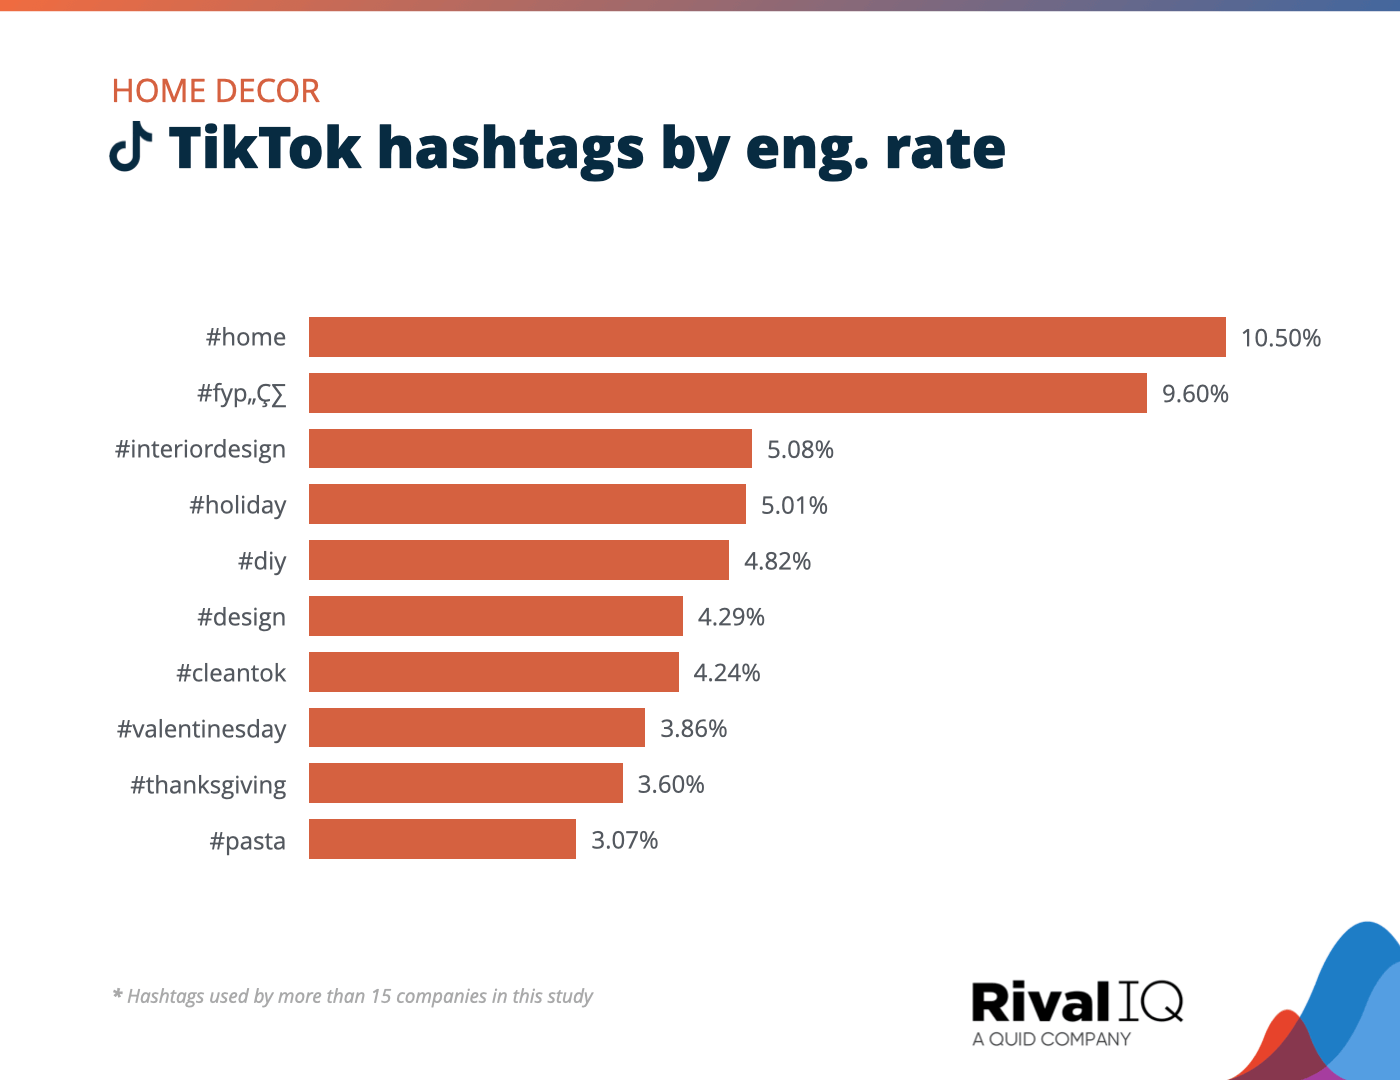
Top TikTok hashtags by engagement rate, Home Decor
Just like on Twitter, Home Decor brands stuck with industry-themed hashtags on TikTok like #home and #design to help users find their content.
Influencers Social Media Benchmarks
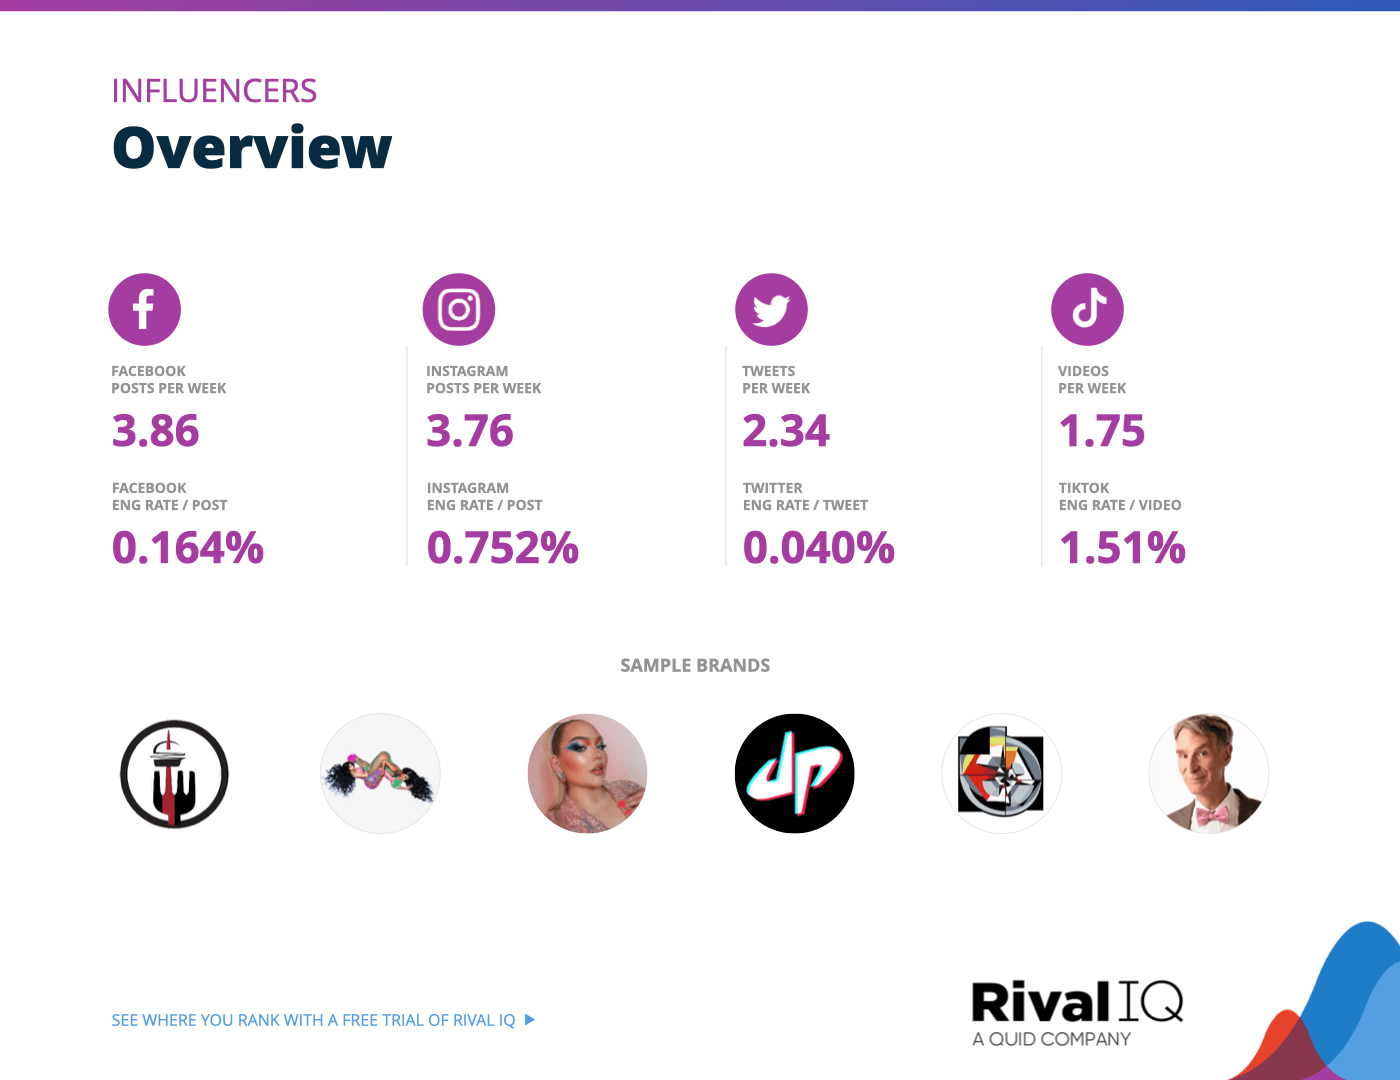
Influencers earned 3x the median engagement rate on Facebook and nearly 2x the median on Instagram this year. These creators also finished above the median on Twitter but a little behind the curve on TikTok.
Ideas to boost that engagement even more:
- Motivational hashtags like #NeverGiveUp and #MotivationMonday resonated with fans on Instagram.
- Try shaking up your posting frequency and content on TikTok to dominate on this channel as well.
Overview of all benchmarks, Influencers
Notable brands in this year’s report include Bill Nye, Cardi B, Dude Perfect, Jordan B. Peterson, Naughty Fork, and Nikkie de Jager.
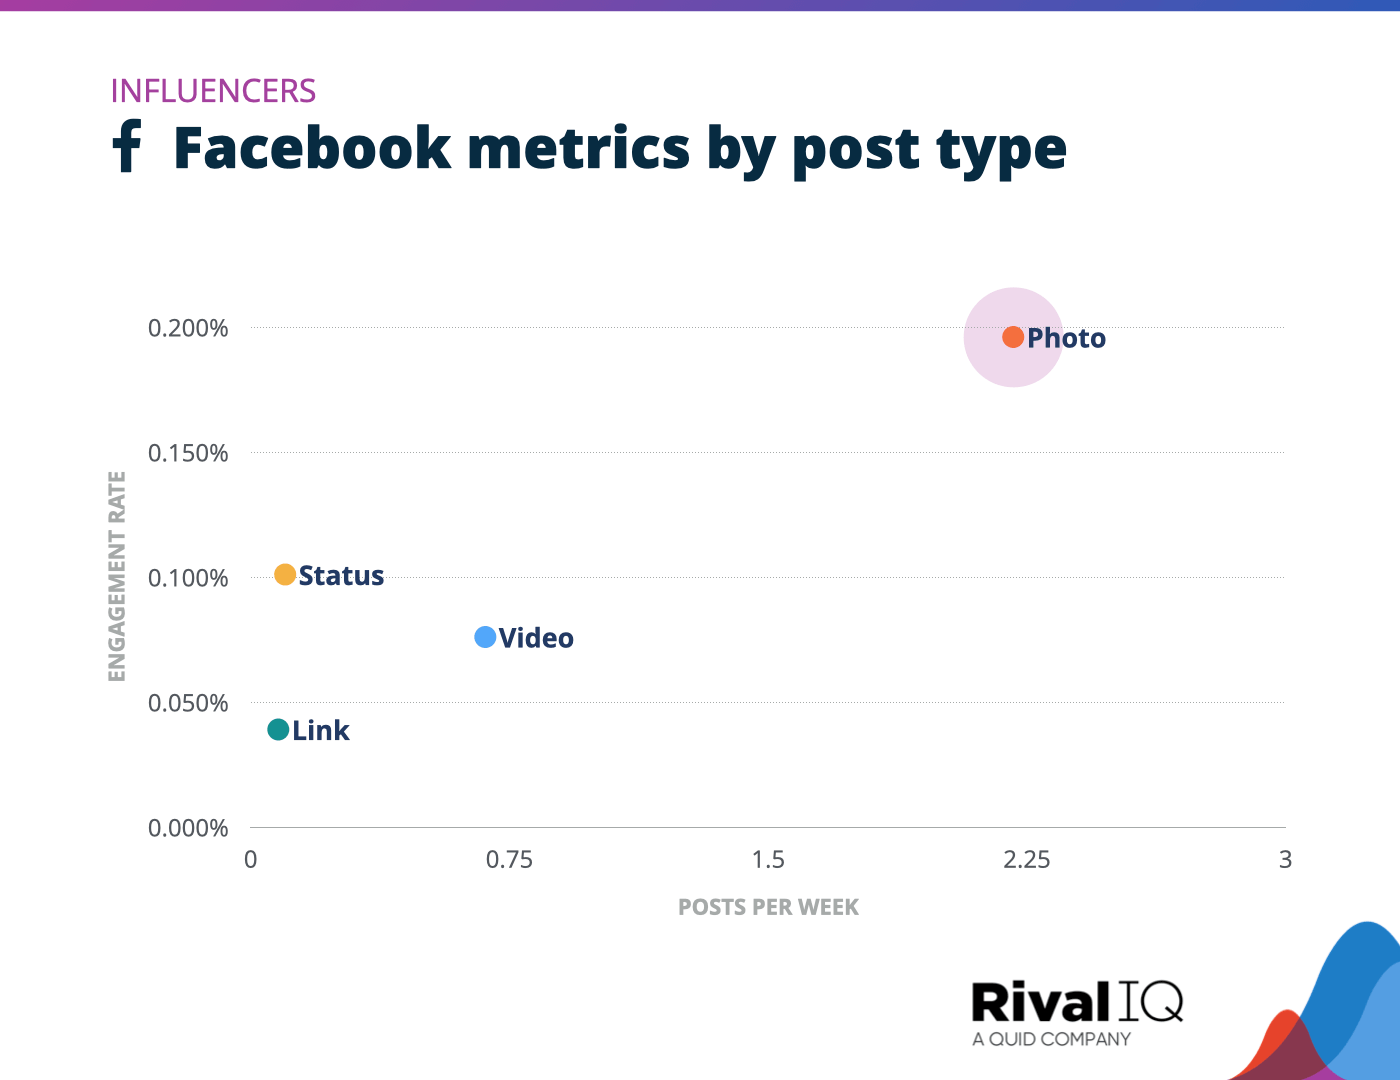
Facebook posts per week and engagement rate by post type, Influencers
Photos perform about twice as well as the next most engaging post type for Influencers, so concentrating efforts here is a smart move.
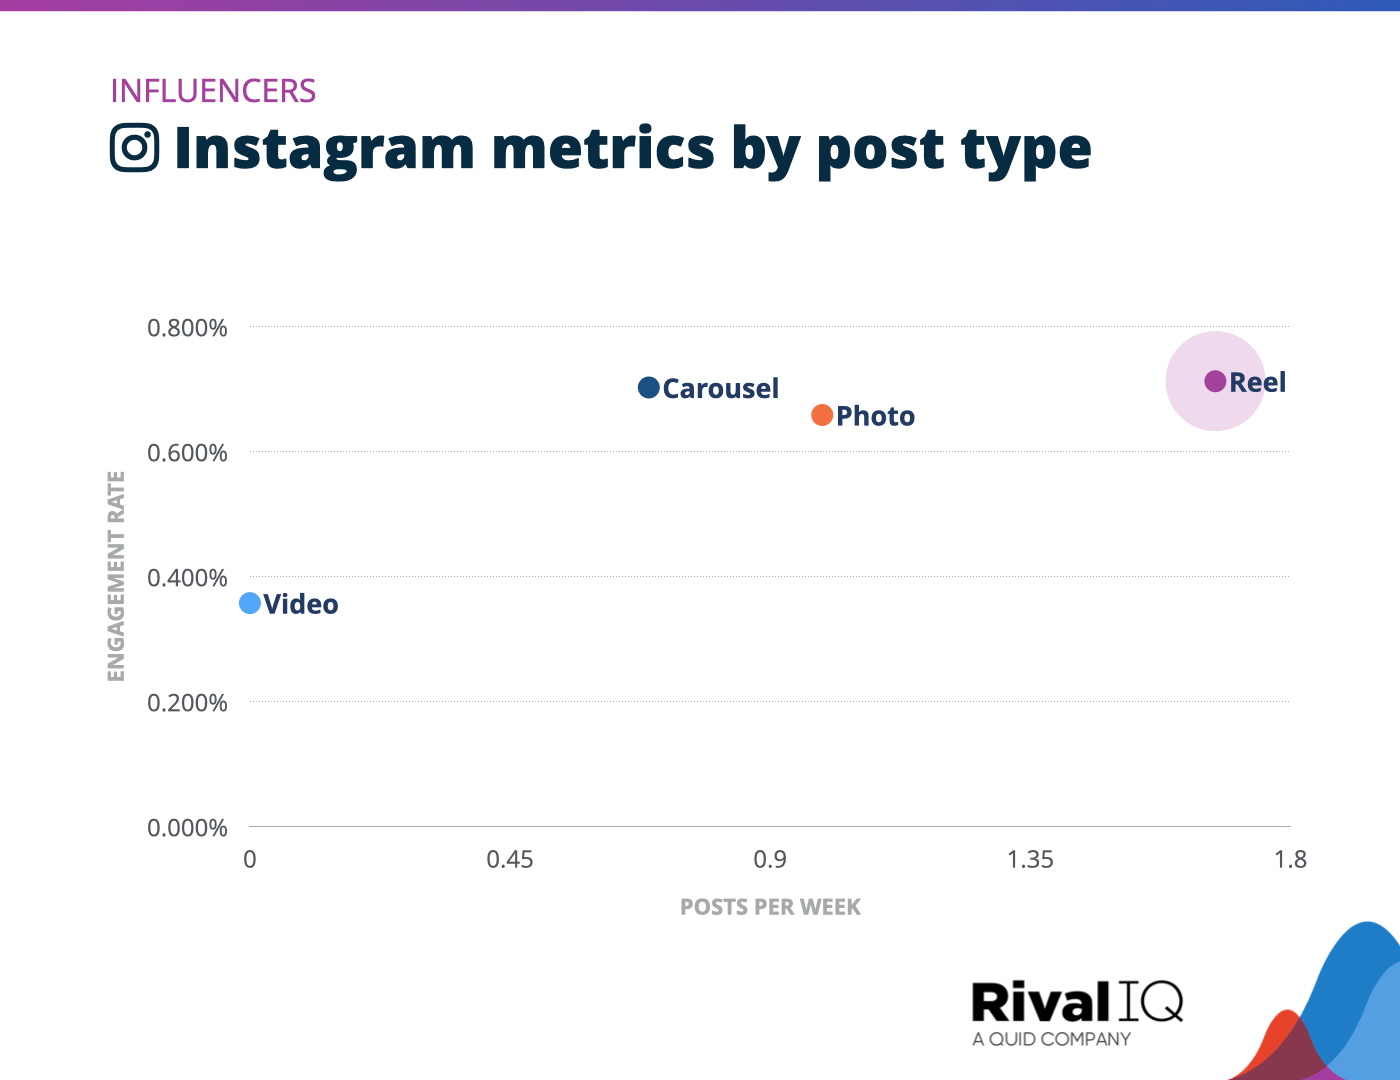
Instagram posts per week and engagement rate by post type, Influencers
Reels, photos, and carousels were neck and neck for influencer engagement rates this year, while video predictably lagged.
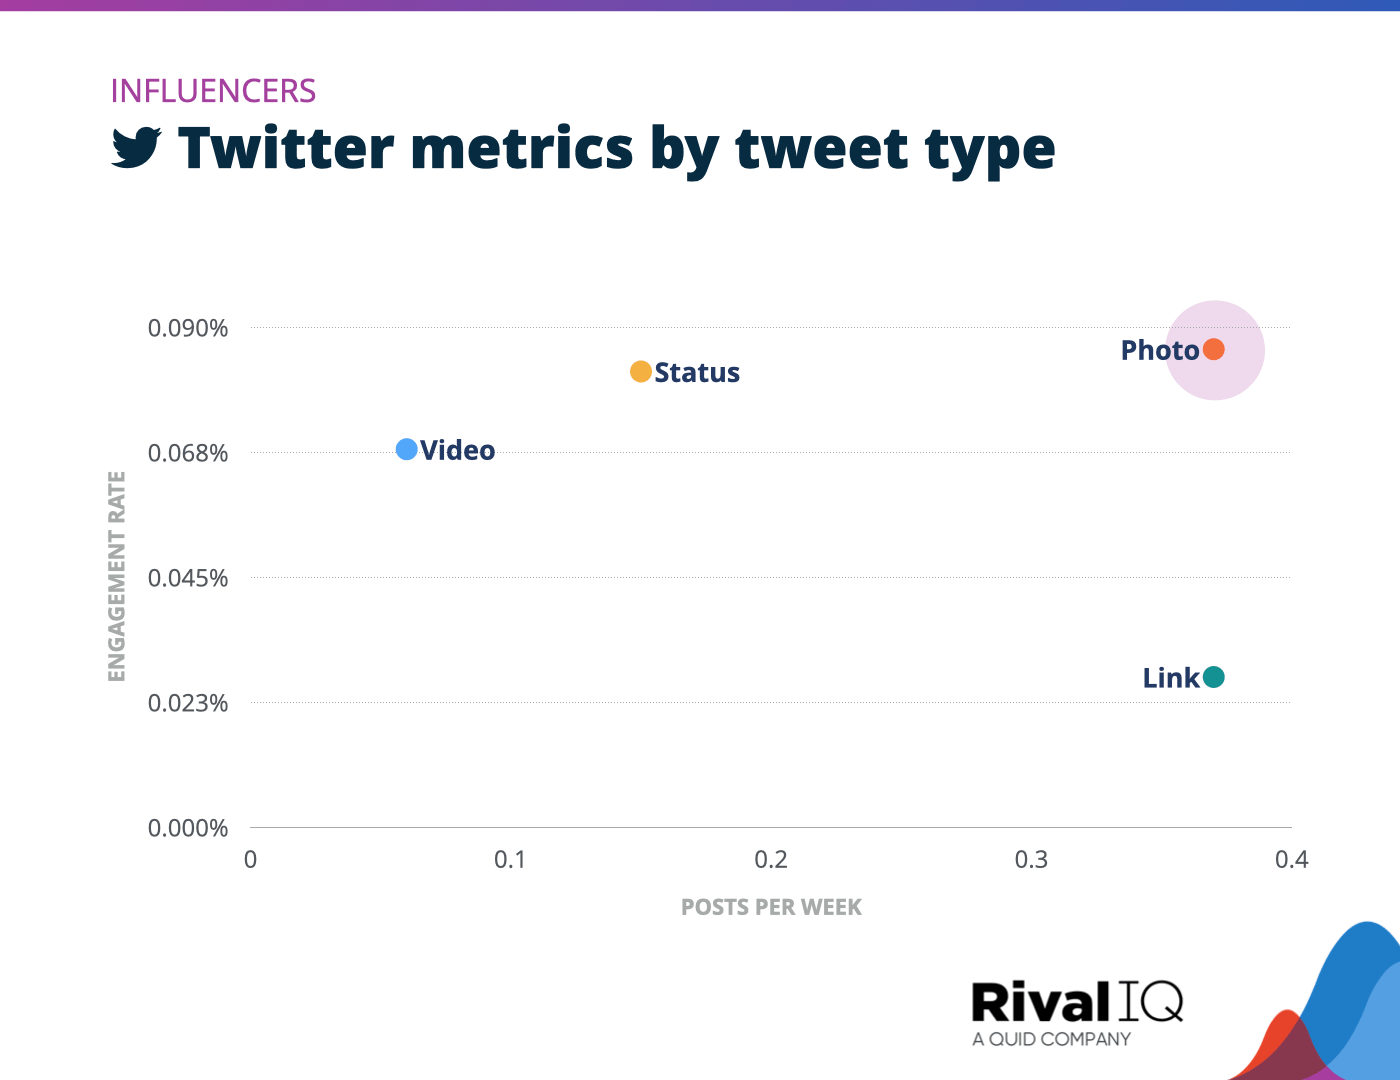
Twitter posts per week and engagement rate by tweet type, Influencers
Photo tweets topped the Influencer Twitter charts this year, but status updates weren’t far behind.
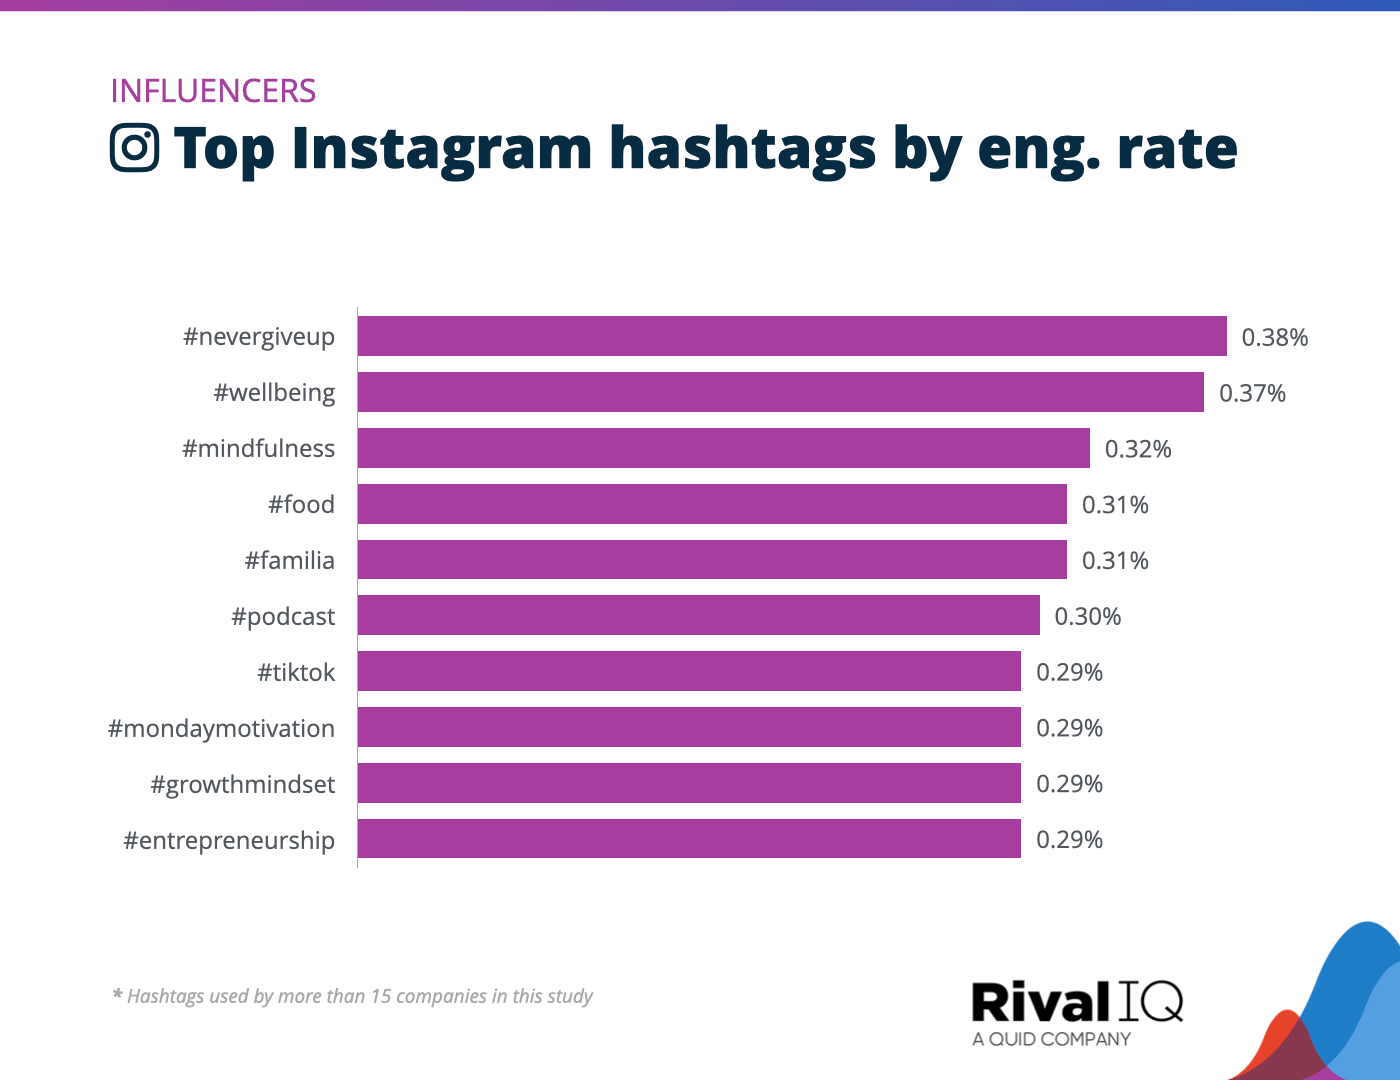
Top Instagram hashtags by engagement rate, Influencers
Influencers were all about the motivational hashtags on Instagram this year, with #NeverGiveUp, #MondayMotivation, and #GrowthMindset earning high engagement rates.
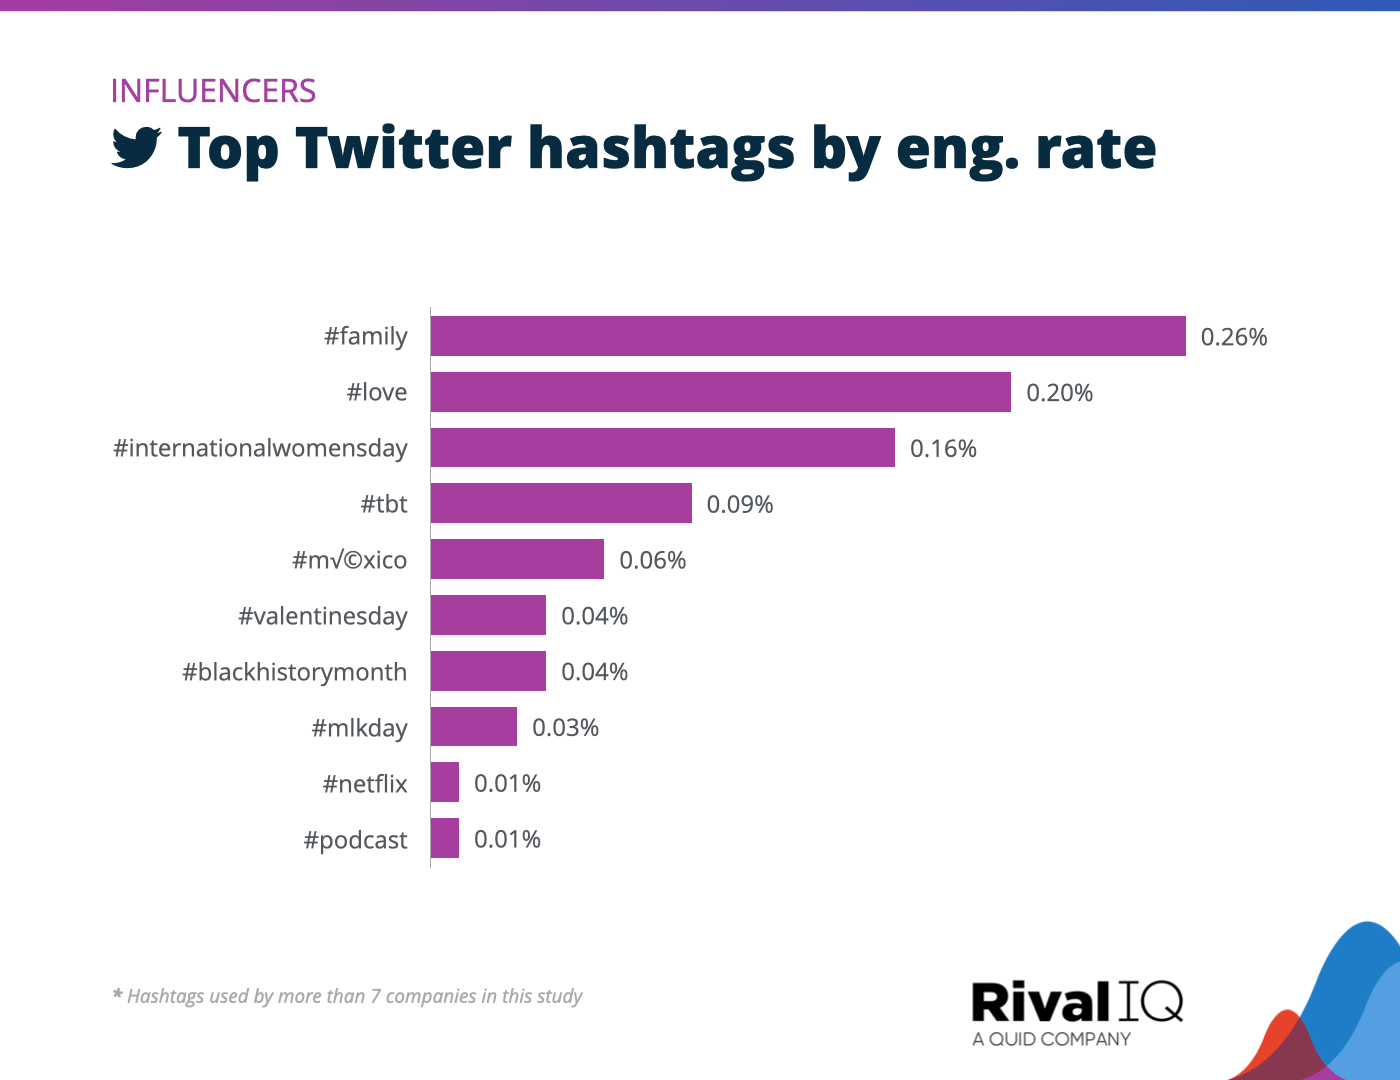
Top Twitter hashtags by engagement rate, Influencers
#Love was in the air for Influencers on Twitter this year, with hashtags like #family and #ValentinesDay performing well.
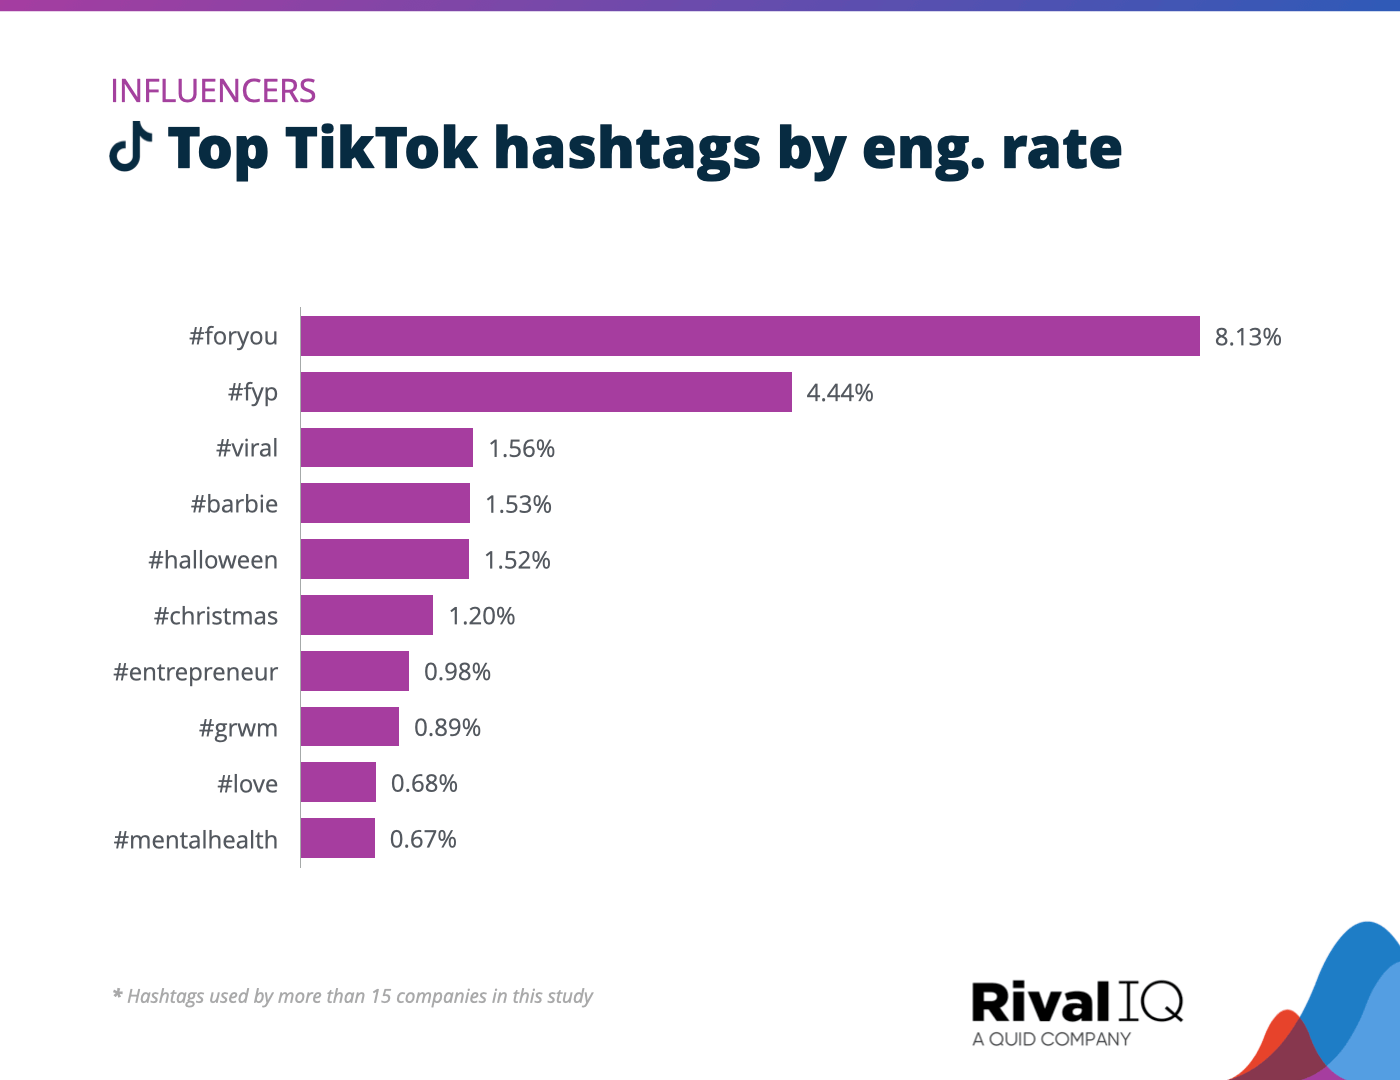
Top TikTok hashtags by engagement rate, Influencers
TikTok-themed hashtags like #ForYou, #fyp, and #viral helped Influencers hop onto the For You Page of fans and followers.
Media Social Media Benchmarks
Media posted much more frequently than the median industry across all four channels while managing to hold onto their engagement rates from last year (except on TikTok). No small feat in a year of major social media upheaval.
A few ideas to improve engagement rates:
- Hashtags about current events remain top engagement earners for Media brands.
- Visual posts like photos and Reels performed way better than Media’s favorite post type, links.
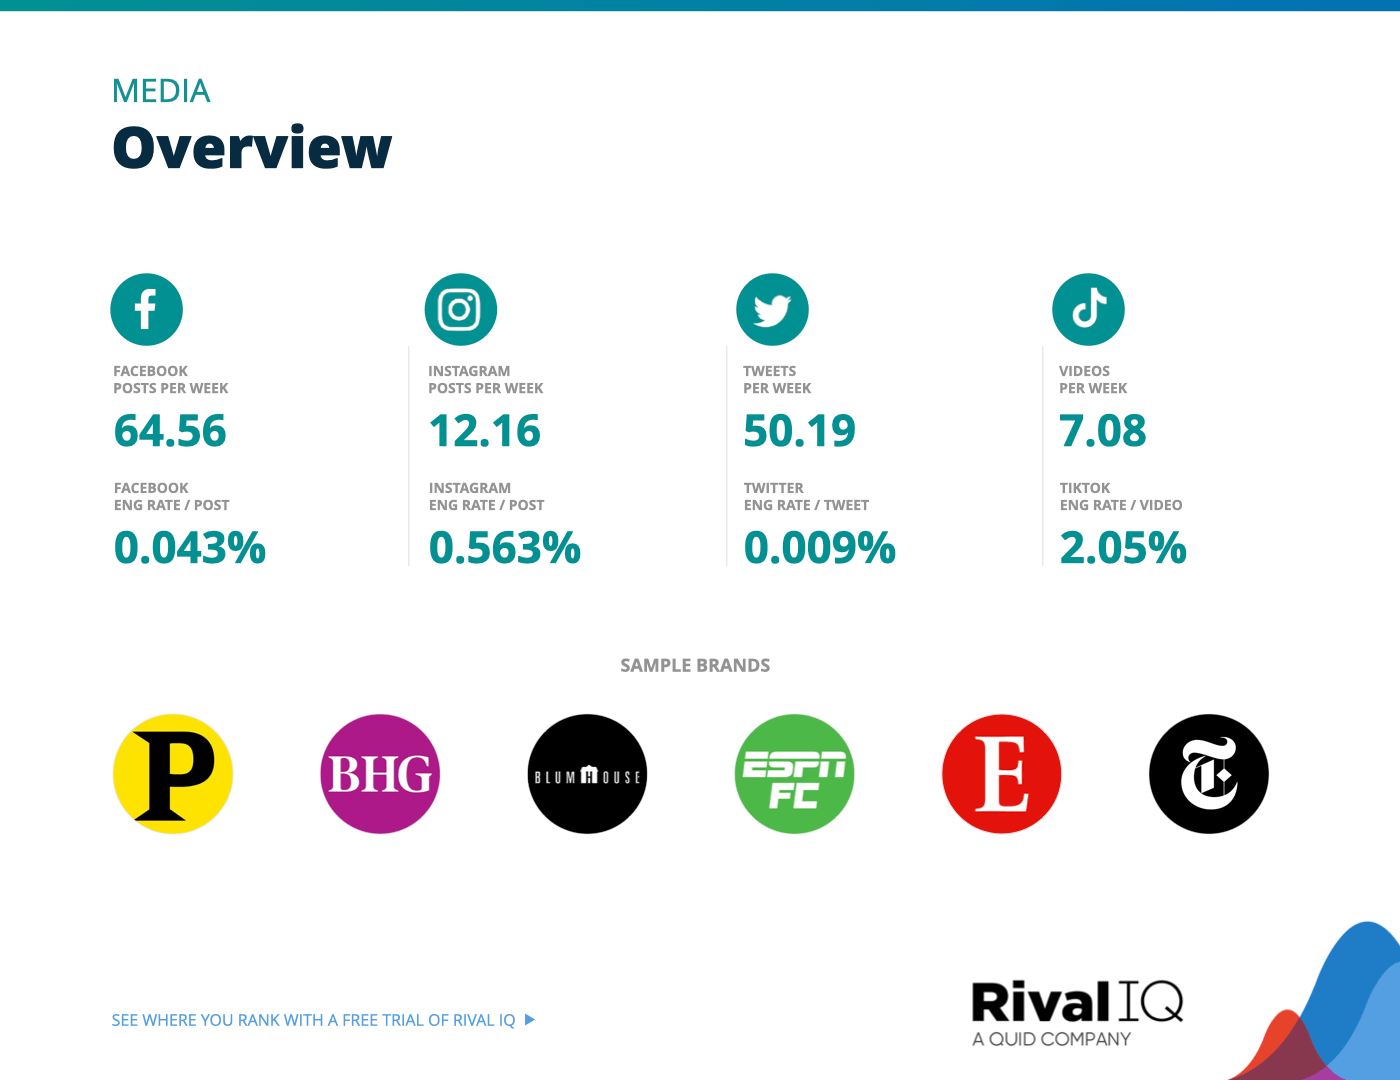
Overview of all benchmarks, Media
Notable brands in this year’s report include Better Homes and Gardens, Blumhouse, The Economist, ESPN FC, The New York Times, and Playbill.
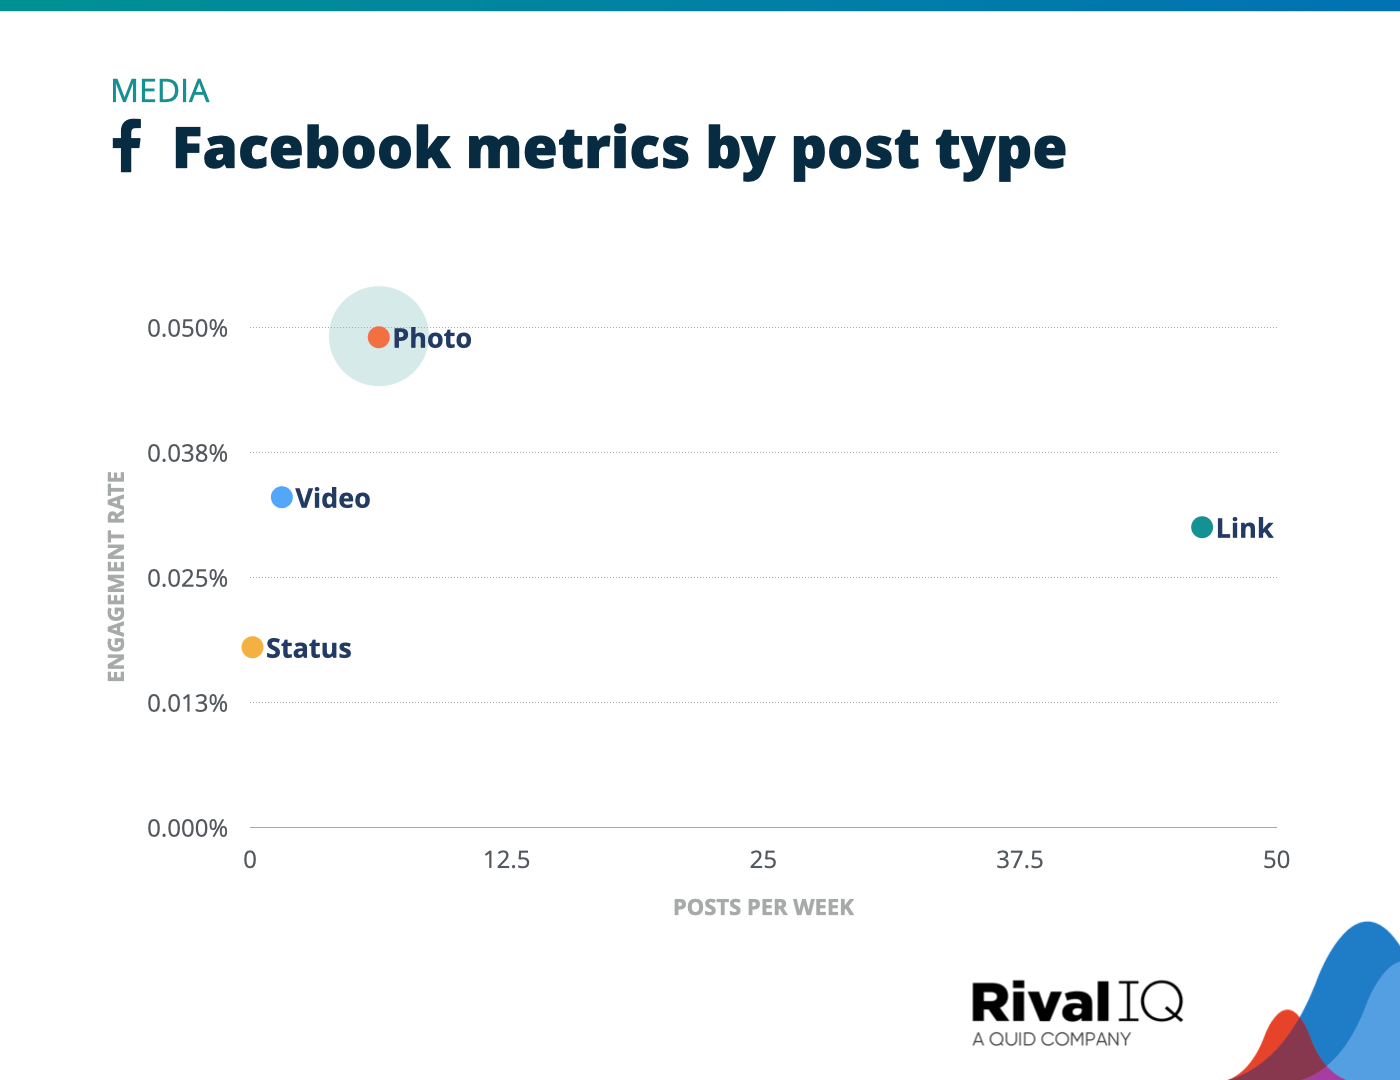
Facebook posts per week and engagement rate by post type, Media
Photos rocked top engagement rates for Media brands on Facebook, though these brands were more than 7x as likely to post a link.
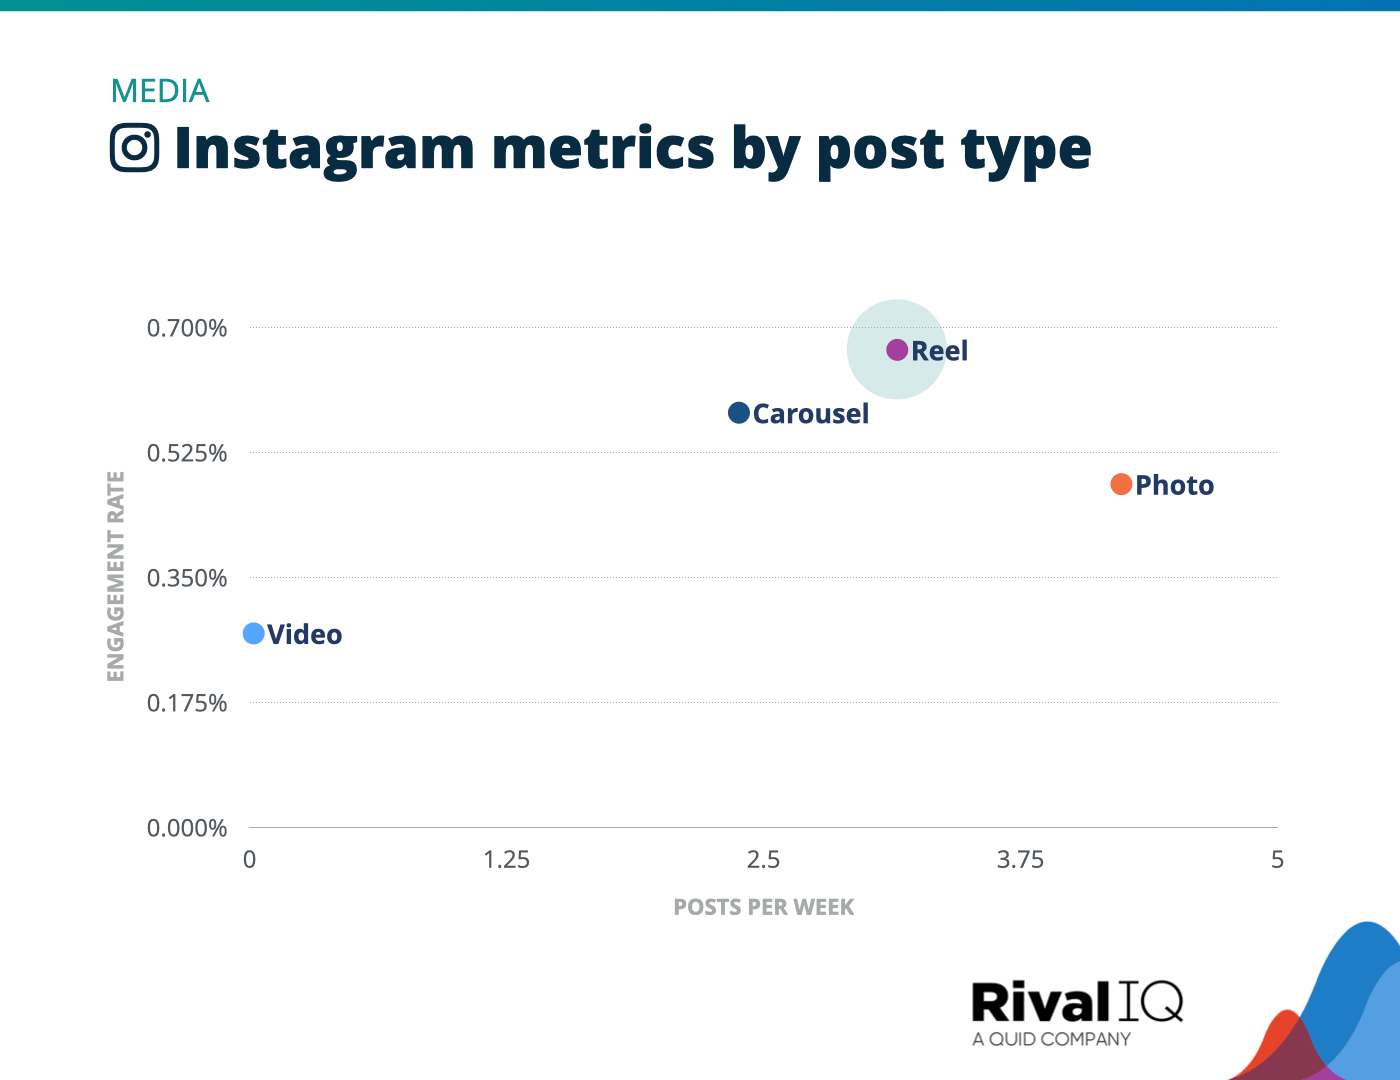
Instagram posts per week and engagement rate by post type, Media
Reels earned more than twice the engagement rates of video posts for Media brands on Instagram this year.
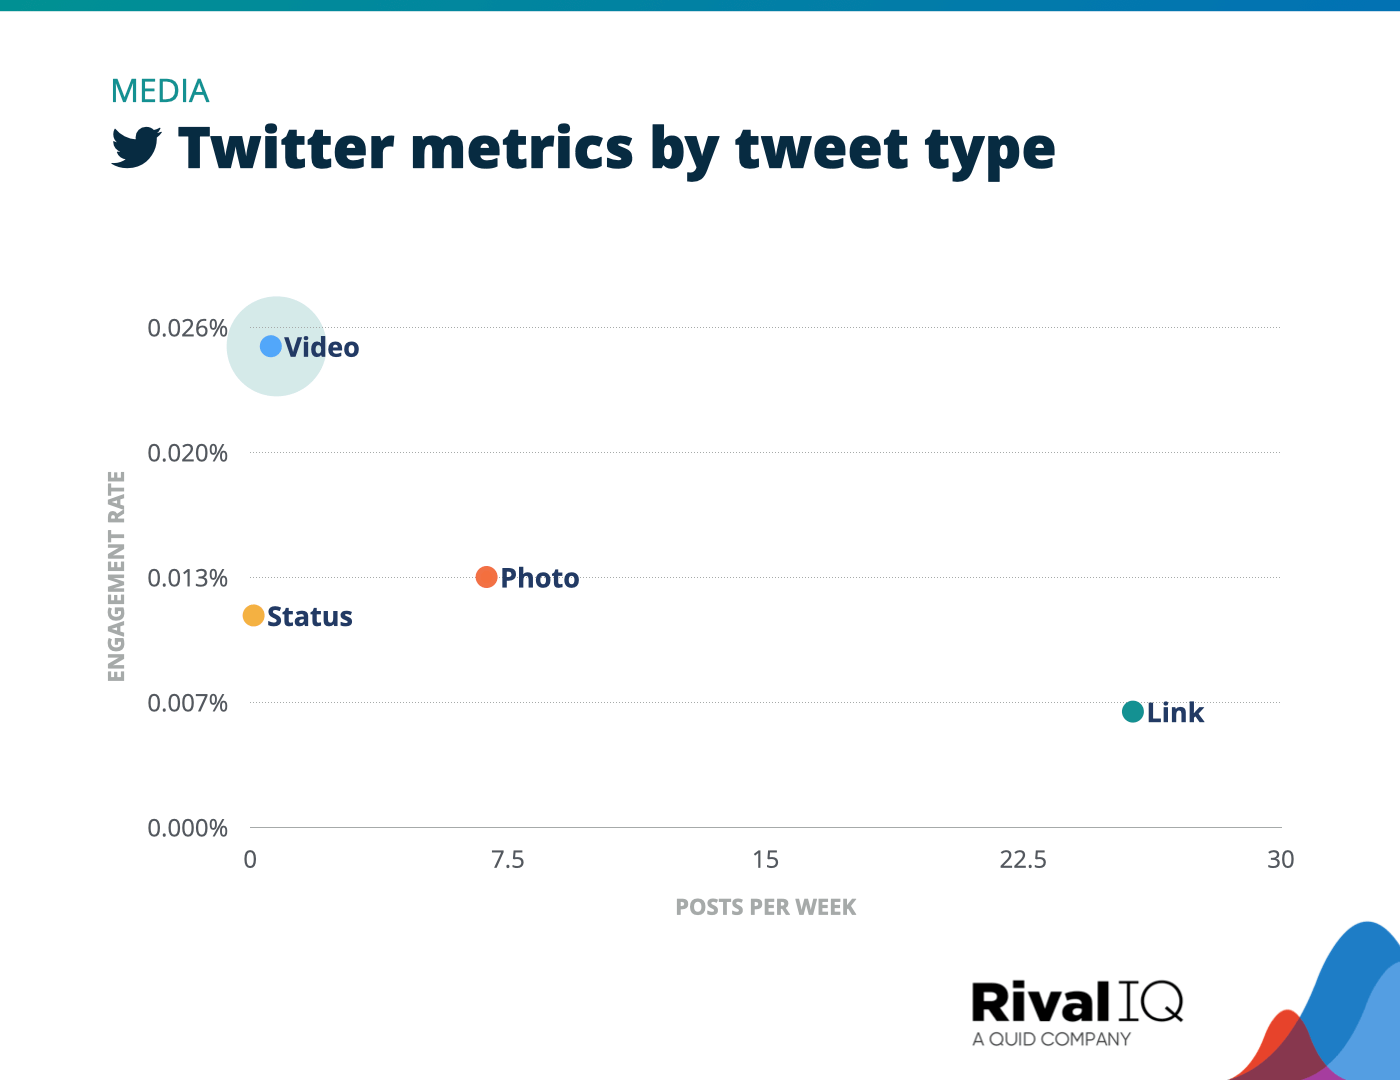
Twitter posts per week and engagement rate by tweet type, Media
Media brands were all about the link tweets, but might want to invest more energy in video tweets, which grabbed more than 4x the engagement rates.
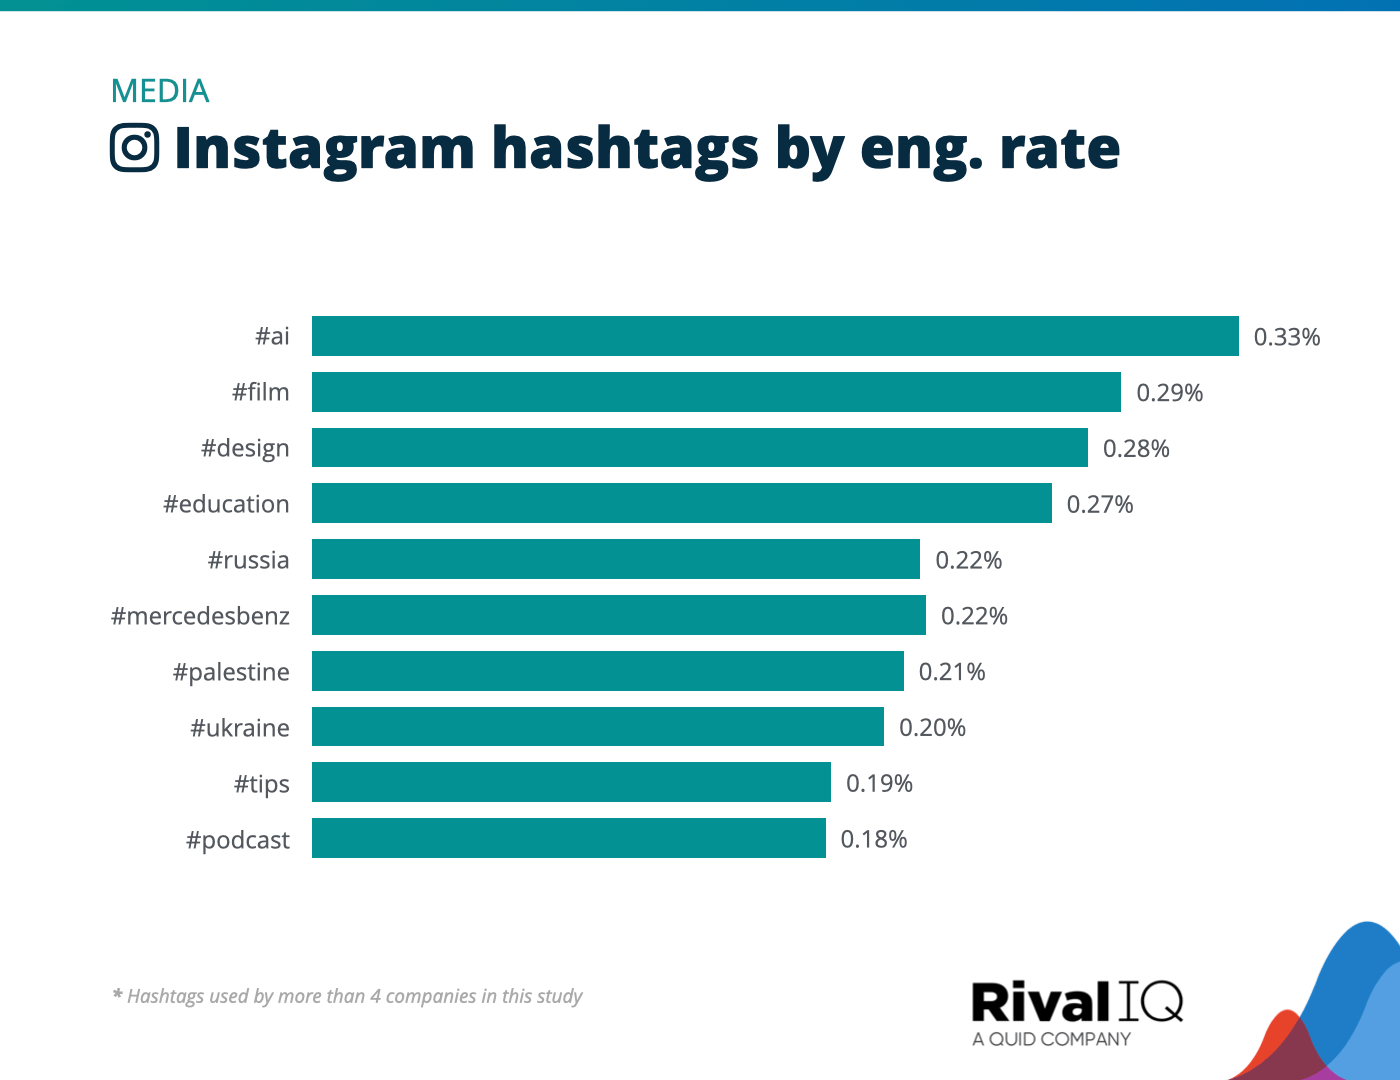
Top Instagram hashtags by engagement rate, Media
Media brands favored hashtags that helped followers get the news and updates they were looking for like #AI and #Palestine.
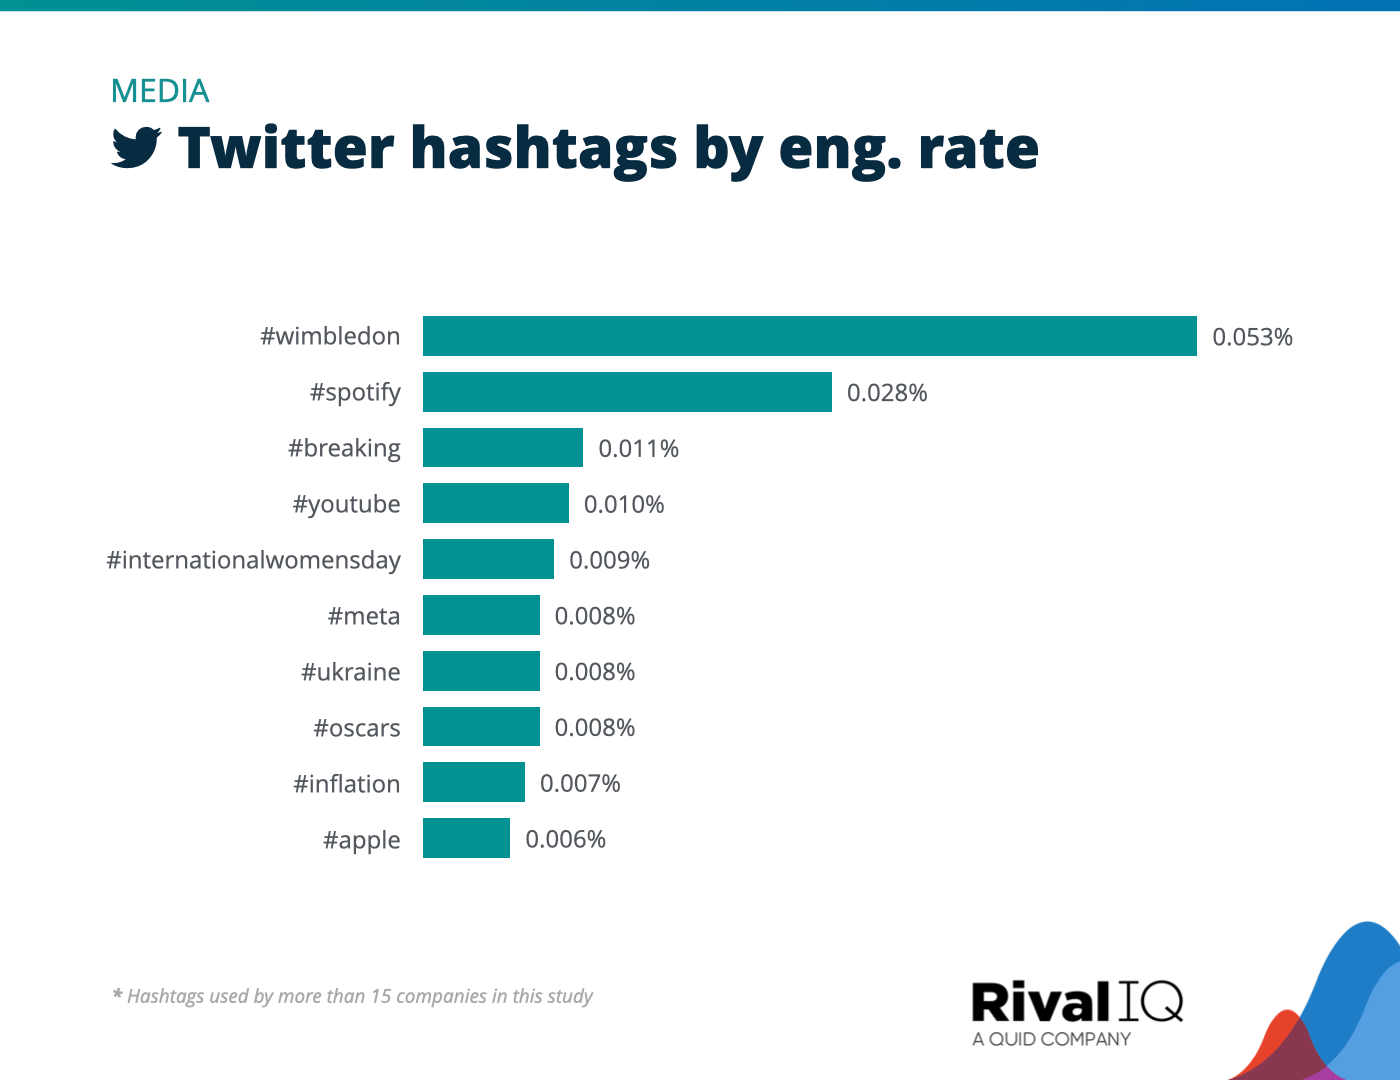
Top Twitter hashtags by engagement rate, Media
Just like on Instagram, current events like #Wimbledon and #Oscars won the day for Media brands on Twitter.
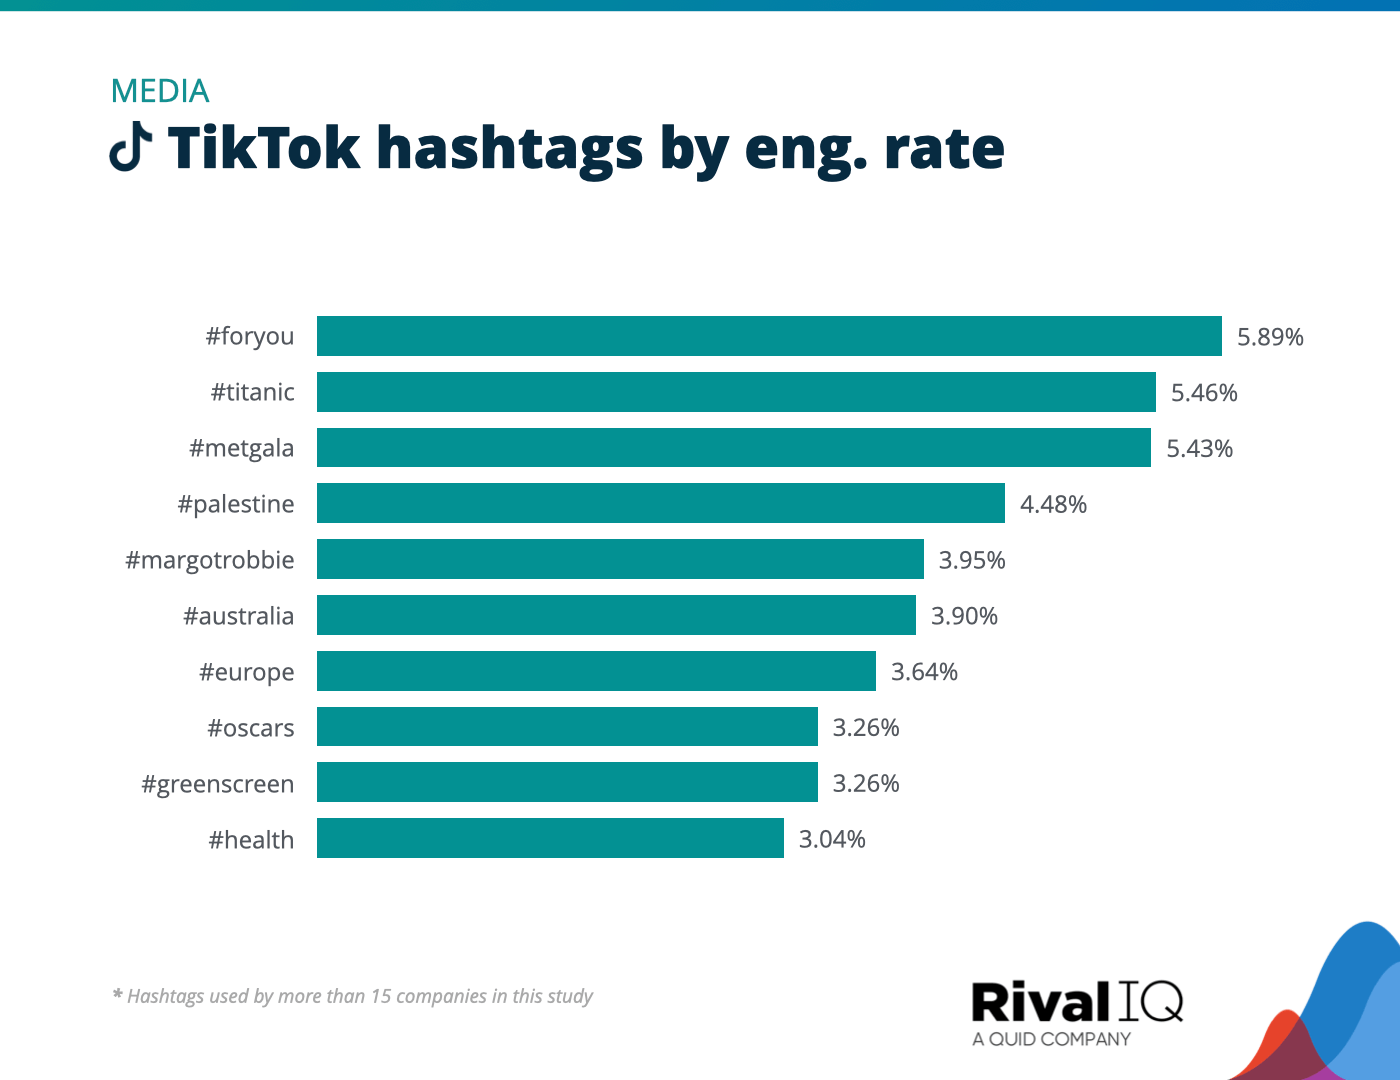
Top TikTok hashtags by engagement rate, Media
Hashtags about the latest celeb or breaking news story trended well for Media brands on TikTok this year like #MetGala and #MargotRobbie.
Nonprofits Social Media Benchmarks
Nonprofits saw above-median engagement rates across all social channels this year and earned the bronze on Twitter. These NGOs posted more often than the median industry on most channels with the exception of TikTok
Suggestions for Nonprofits:
- Event-themed hashtags helped followers find your content.
- Keep that Reel and video tweet success rolling by investing more in video content.
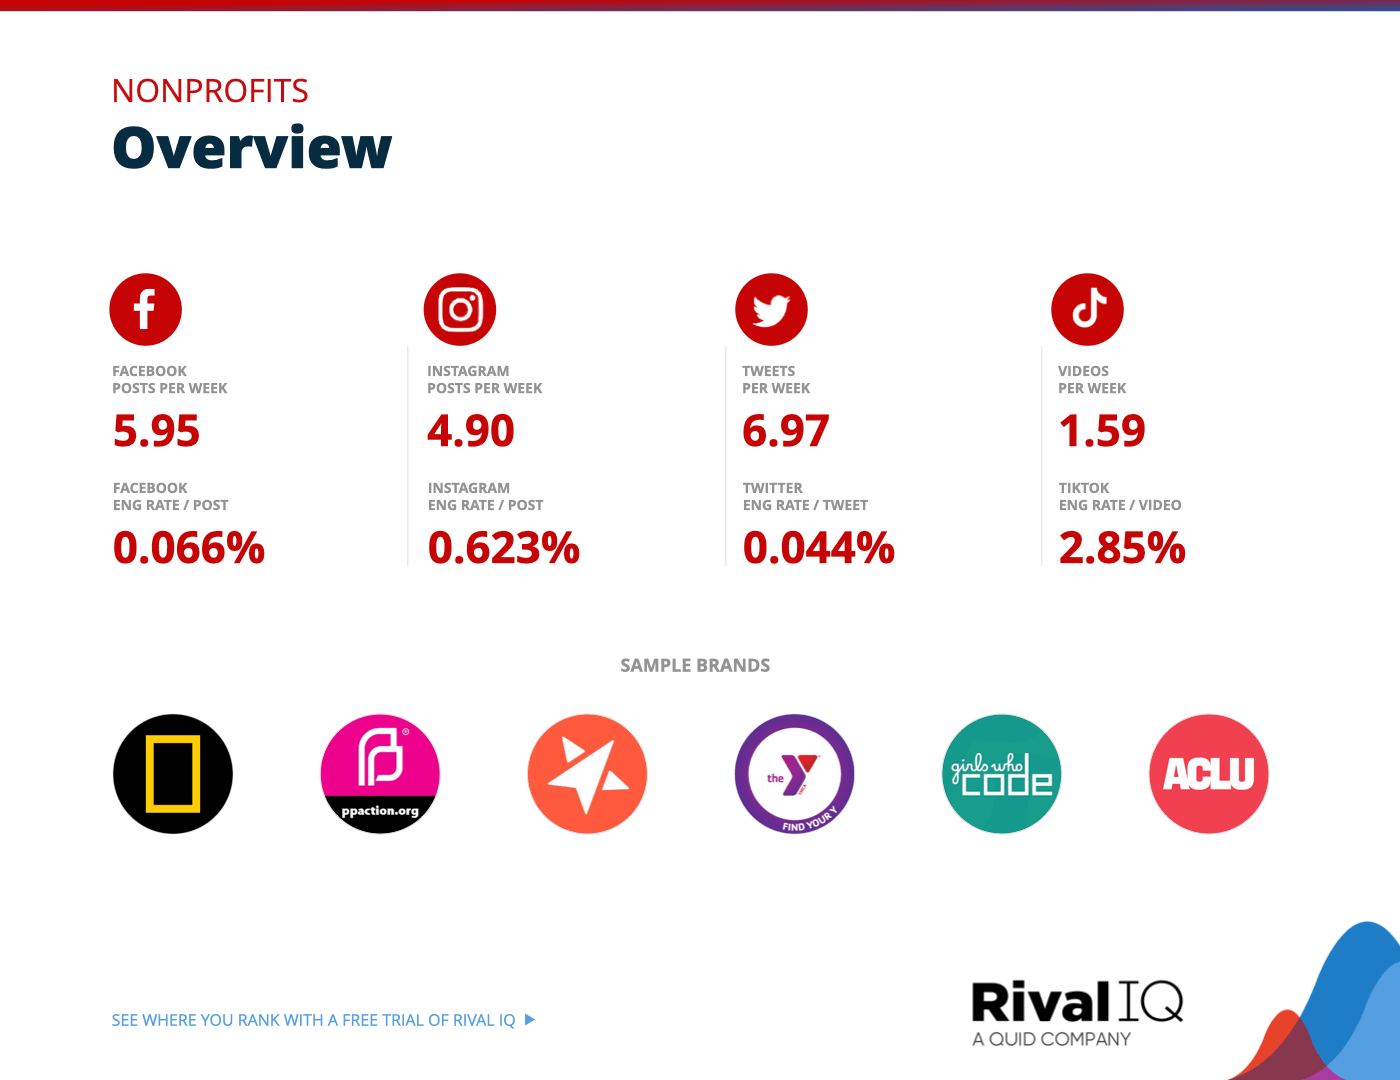
Overview of all benchmarks, Nonprofits
Notable brands in this year’s report include ACLU, Girls Who Code, National Geographic, Planned Parenthood, The Trevor Project, and the YMCA.
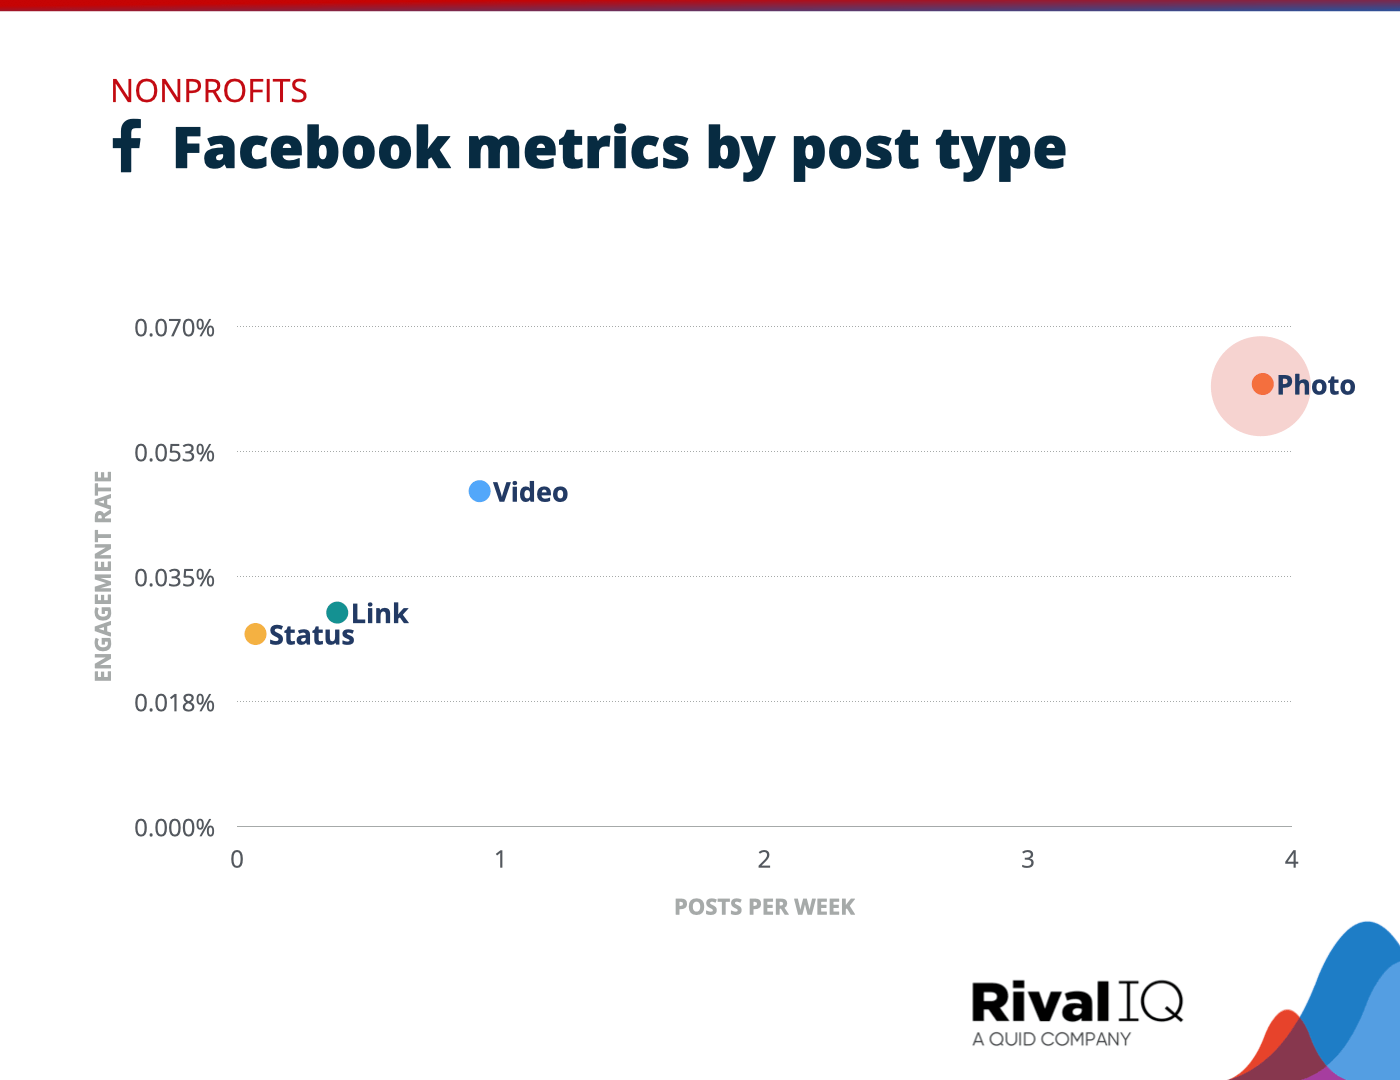
Facebook posts per week and engagement rate by post type, Nonprofits
Photos earned top engagement rates for Nonprofits this year, who shared this post type 4x more often than any other.
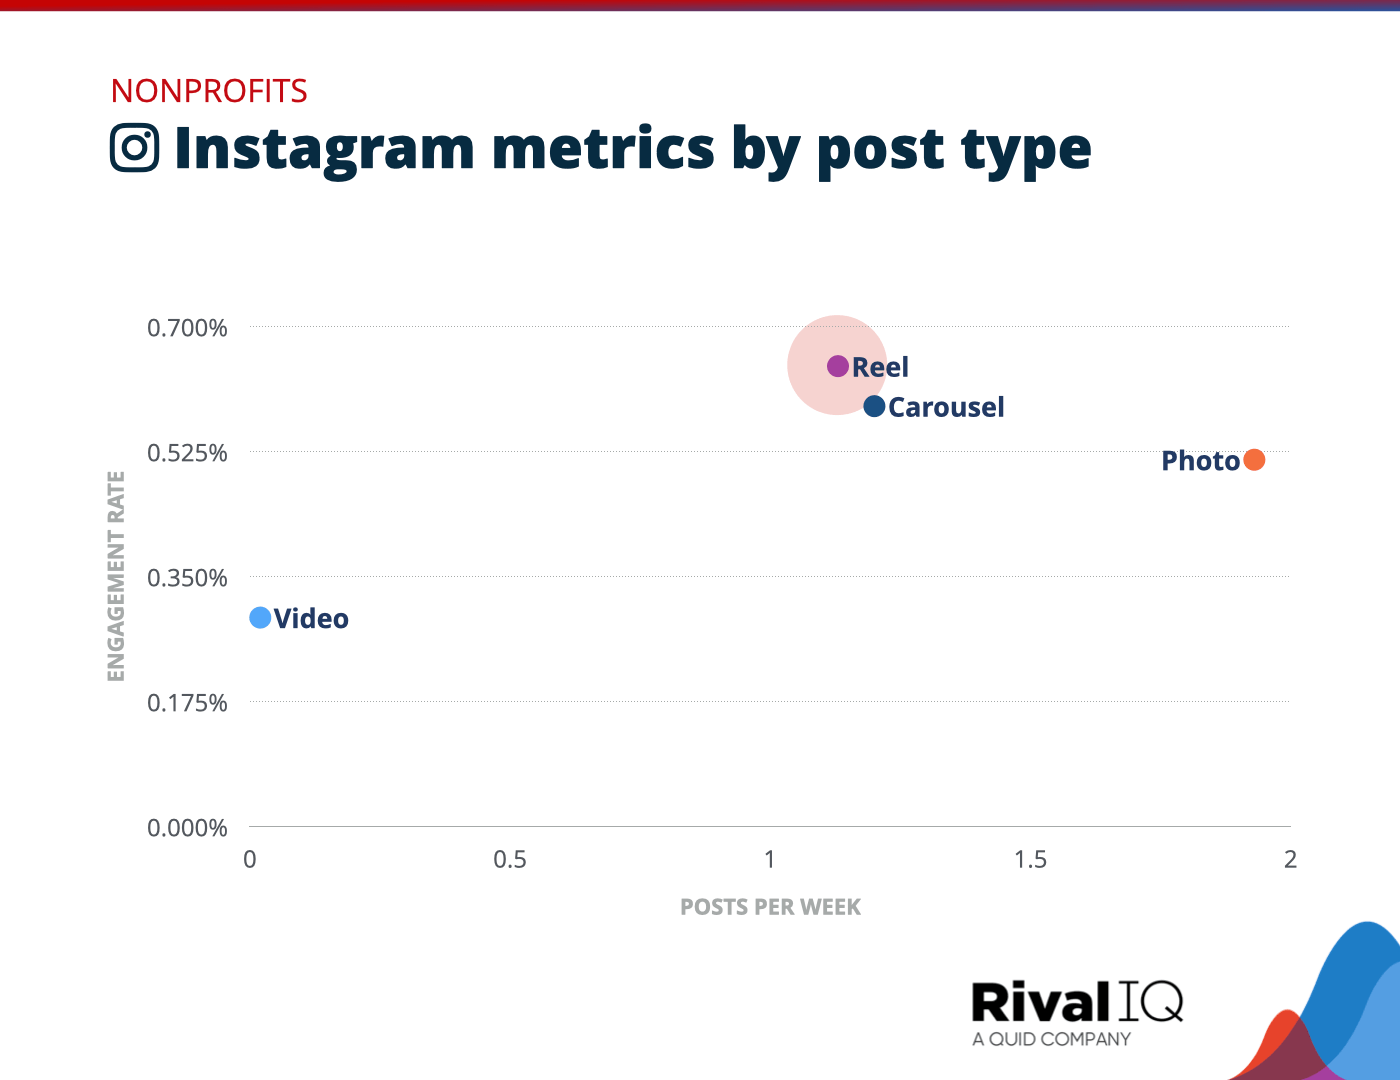
Instagram posts per week and engagement rate by post type, Nonprofits
Reels outdid other posts types for Nonprofits on Instagram this year, who might want to increase their investment in that post type to capture more of their audience’s attention.
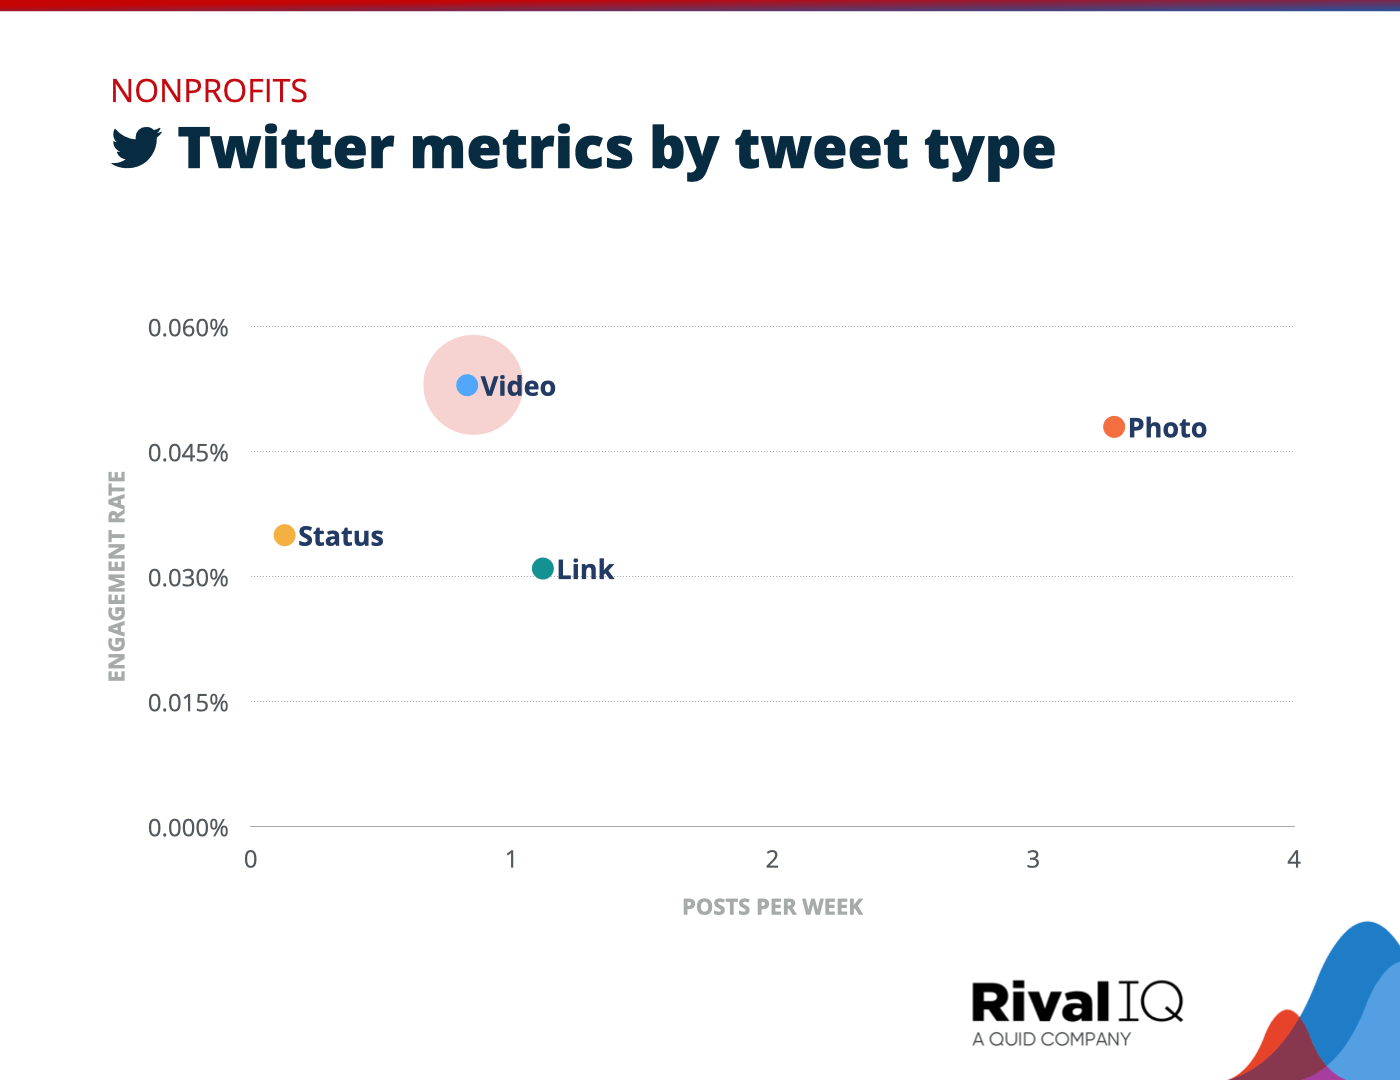
Twitter posts per week and engagement rate by tweet type, Nonprofits
Videos earned top engagement rates for Nonprofits this year on Twitter, but the extra work that goes into producing a video meant photo and link tweets were more common for these organizations.
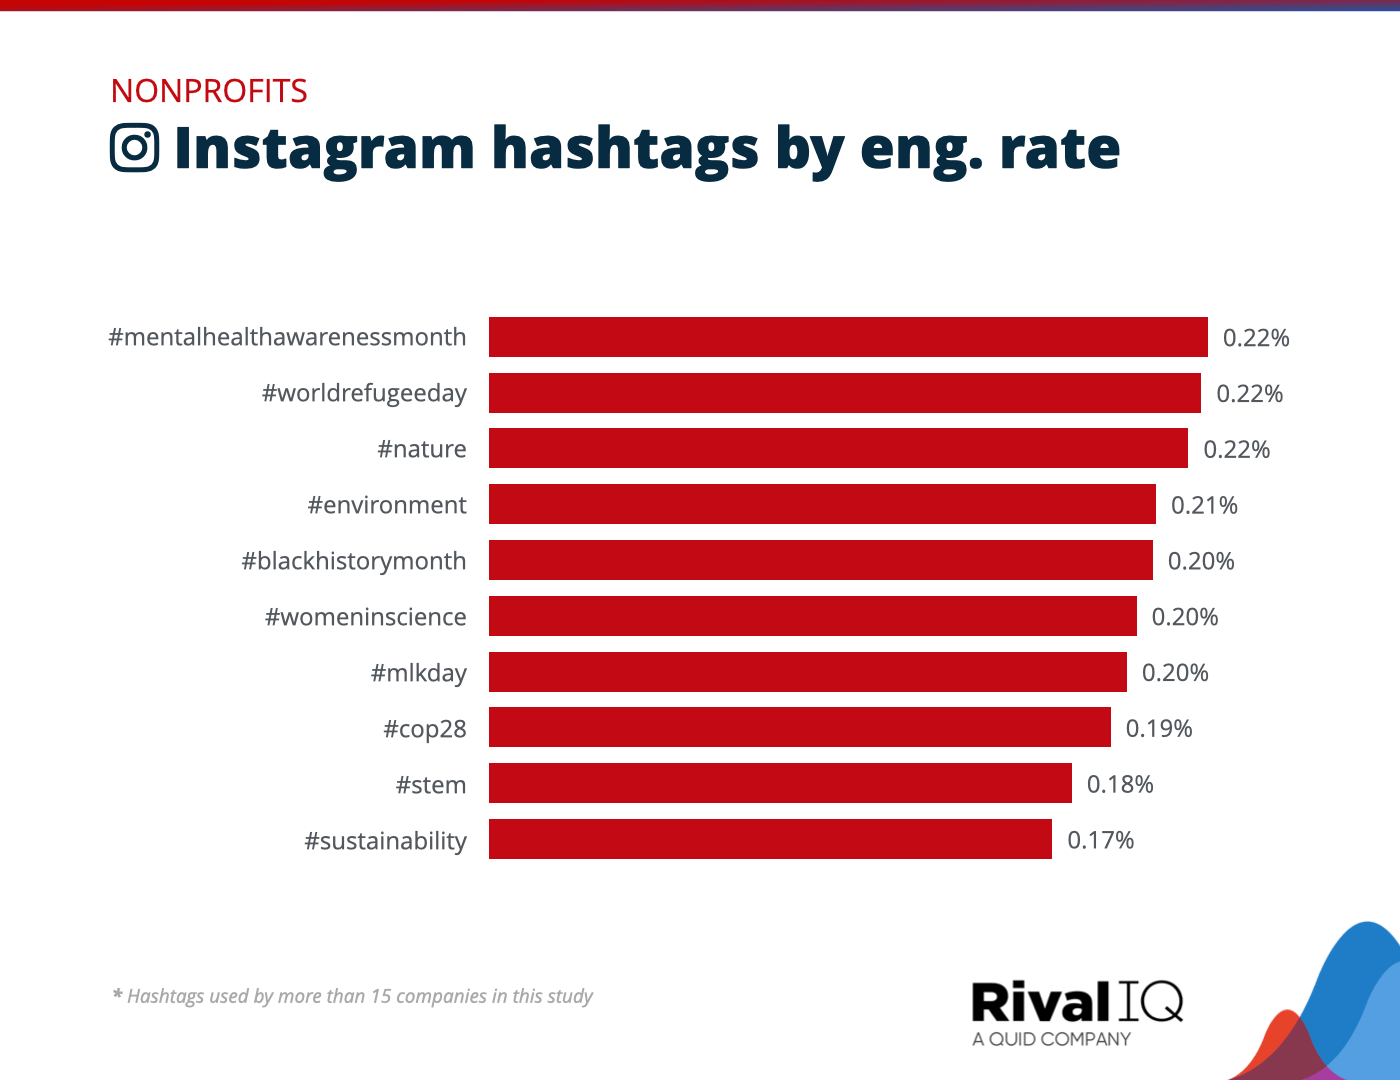
Top Instagram hashtags by engagement rate, Nonprofits
Event-themed hashtags like #BlackHistoryMonth, #COP28, and #WorldRefugeeDay grabbed attention for Nonprofits on Instagram this year.
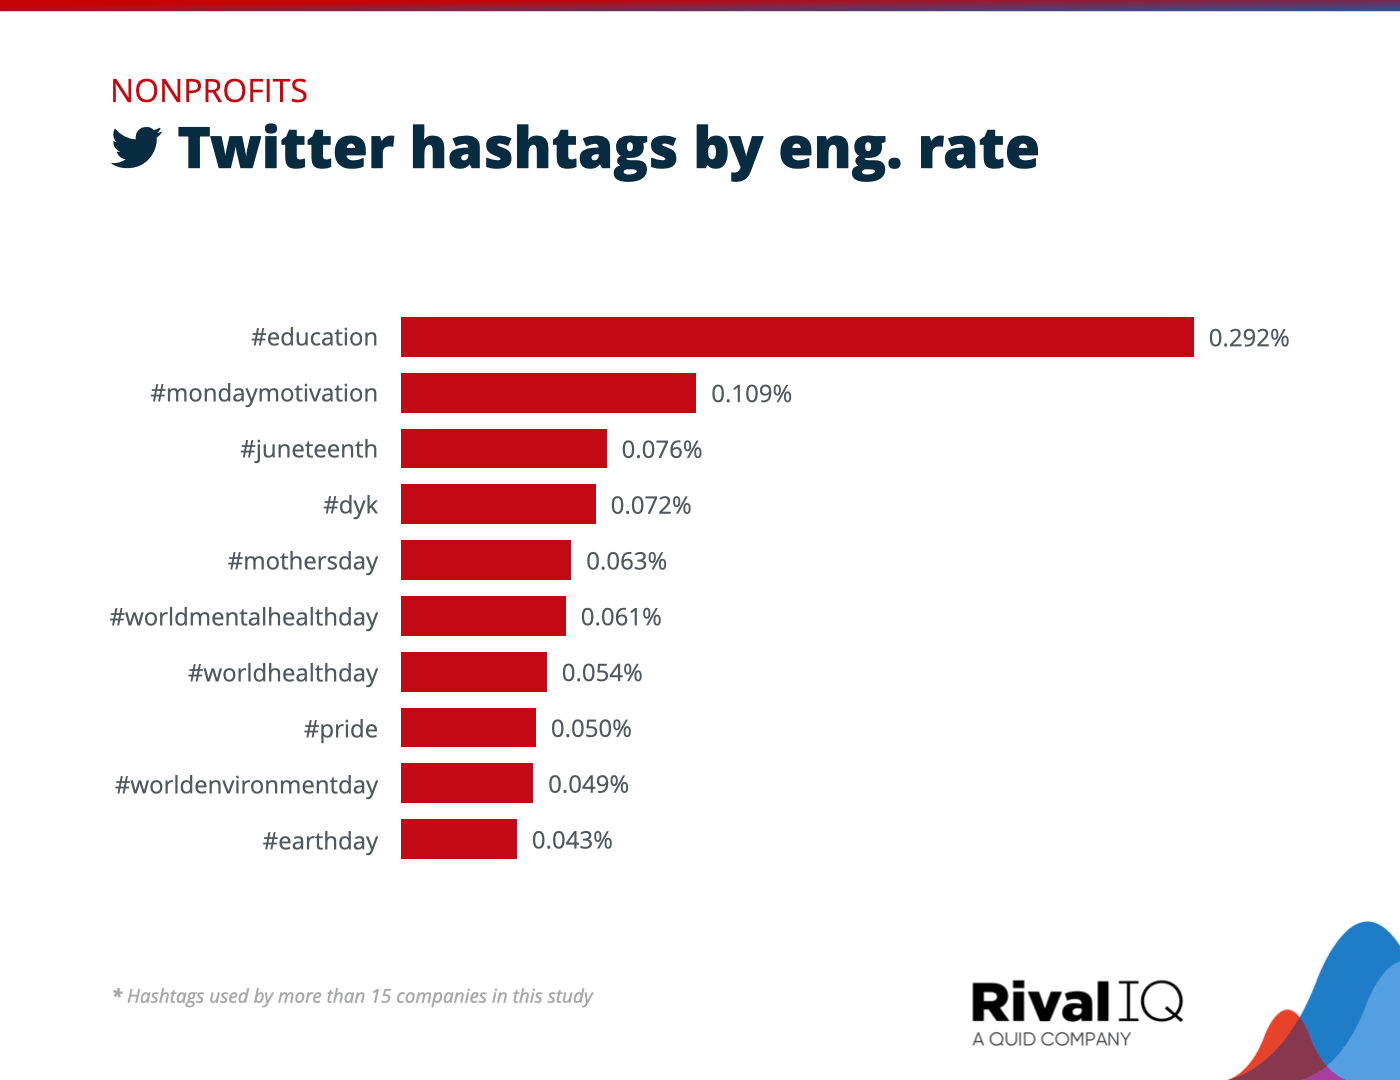
Top Twitter hashtags by engagement rate, Nonprofits
The #education hashtag beat out other Nonprofit hashtags on Twitter by a mile this year, suggesting followers were eager to learn from their favorite orgs.
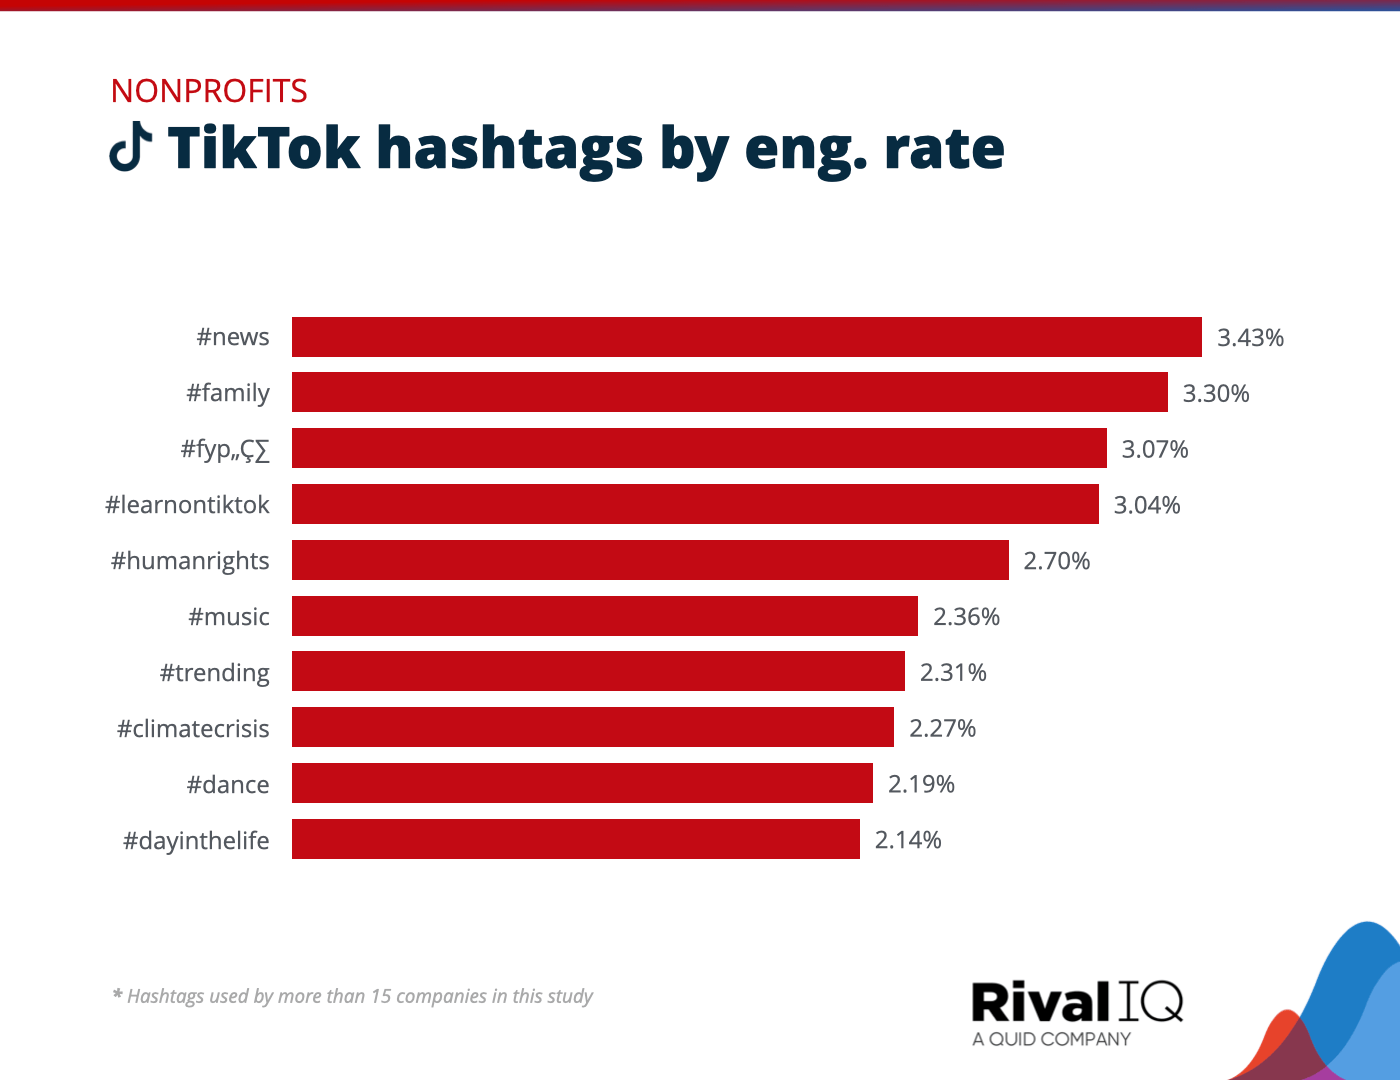
Top TikTok hashtags by engagement rate, Nonprofits
TikTok-themed hashtags like #LearnOnTikTok, #music, and #trending helped Nonprofit followers find what they were looking for on the video channel this year.
Retail Social Media Benchmarks
Retail brands trailed behind other industries across all four channels this year, despite actually increasing engagement rates on Facebook and Instagram.
Some ideas for improving social performance this year:
- Stick with photo posts to help drive up engagement while also experimenting with video, especially Reels and TikToks.
- Don’t miss the chance to remind followers about the chance to shop and give gifts with holiday-themed hashtags like #ValentinesDay and #MothersDay.
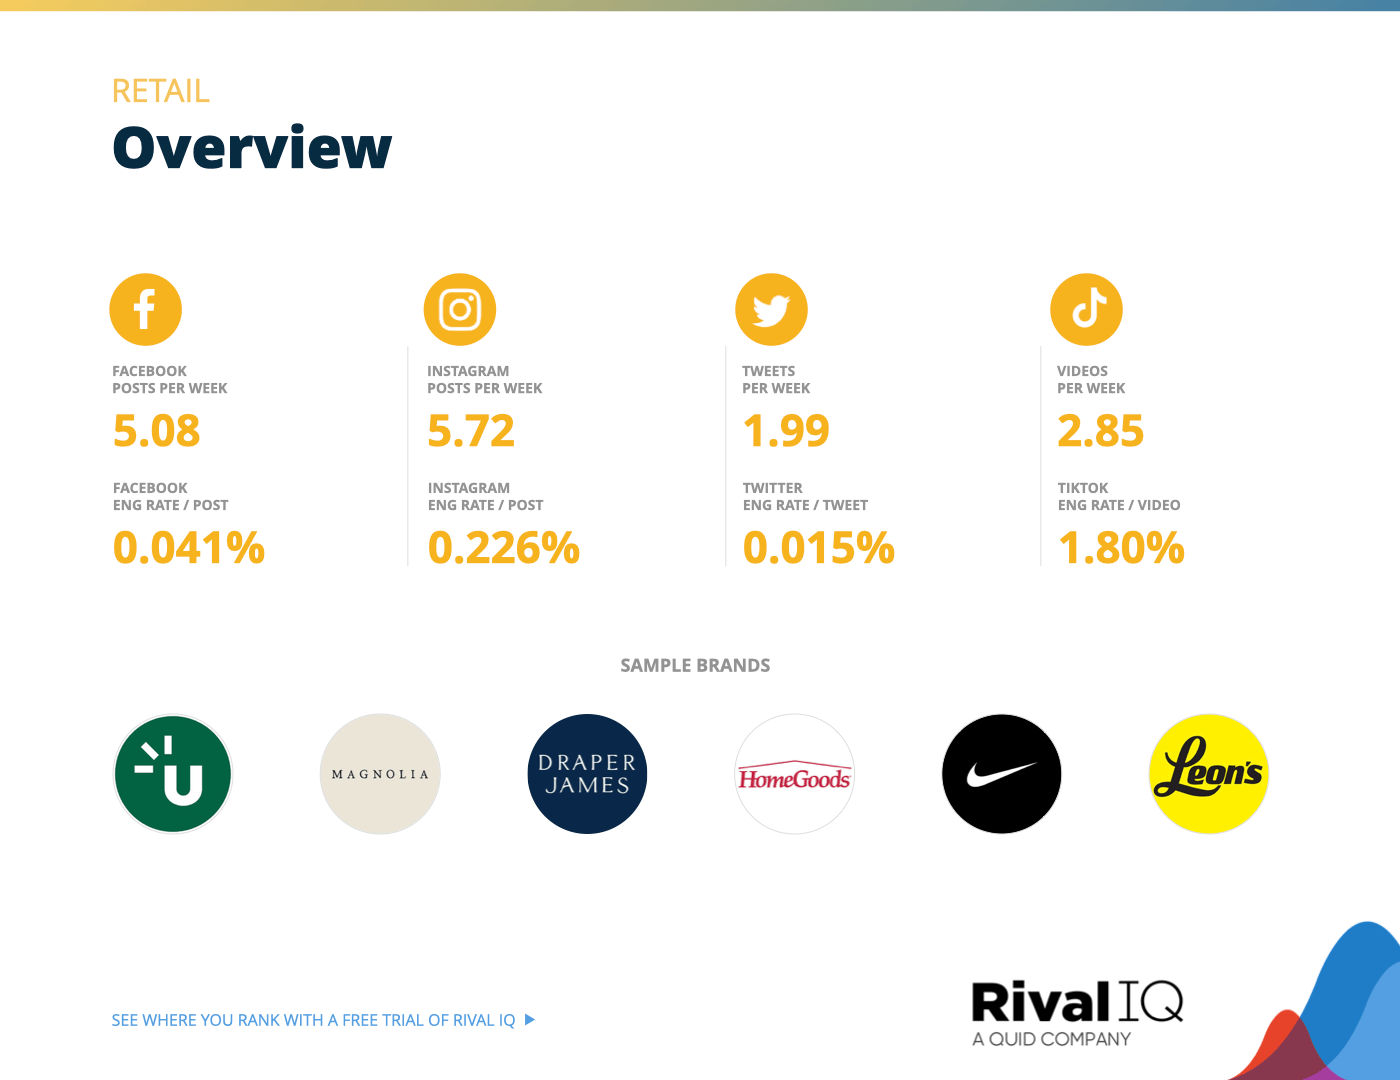
Overview of all benchmarks, Retail
Notable brands in this year’s report include Draper James, Homegoods, Leon’s, Magnolia, Nike, and Uncommon Goods.
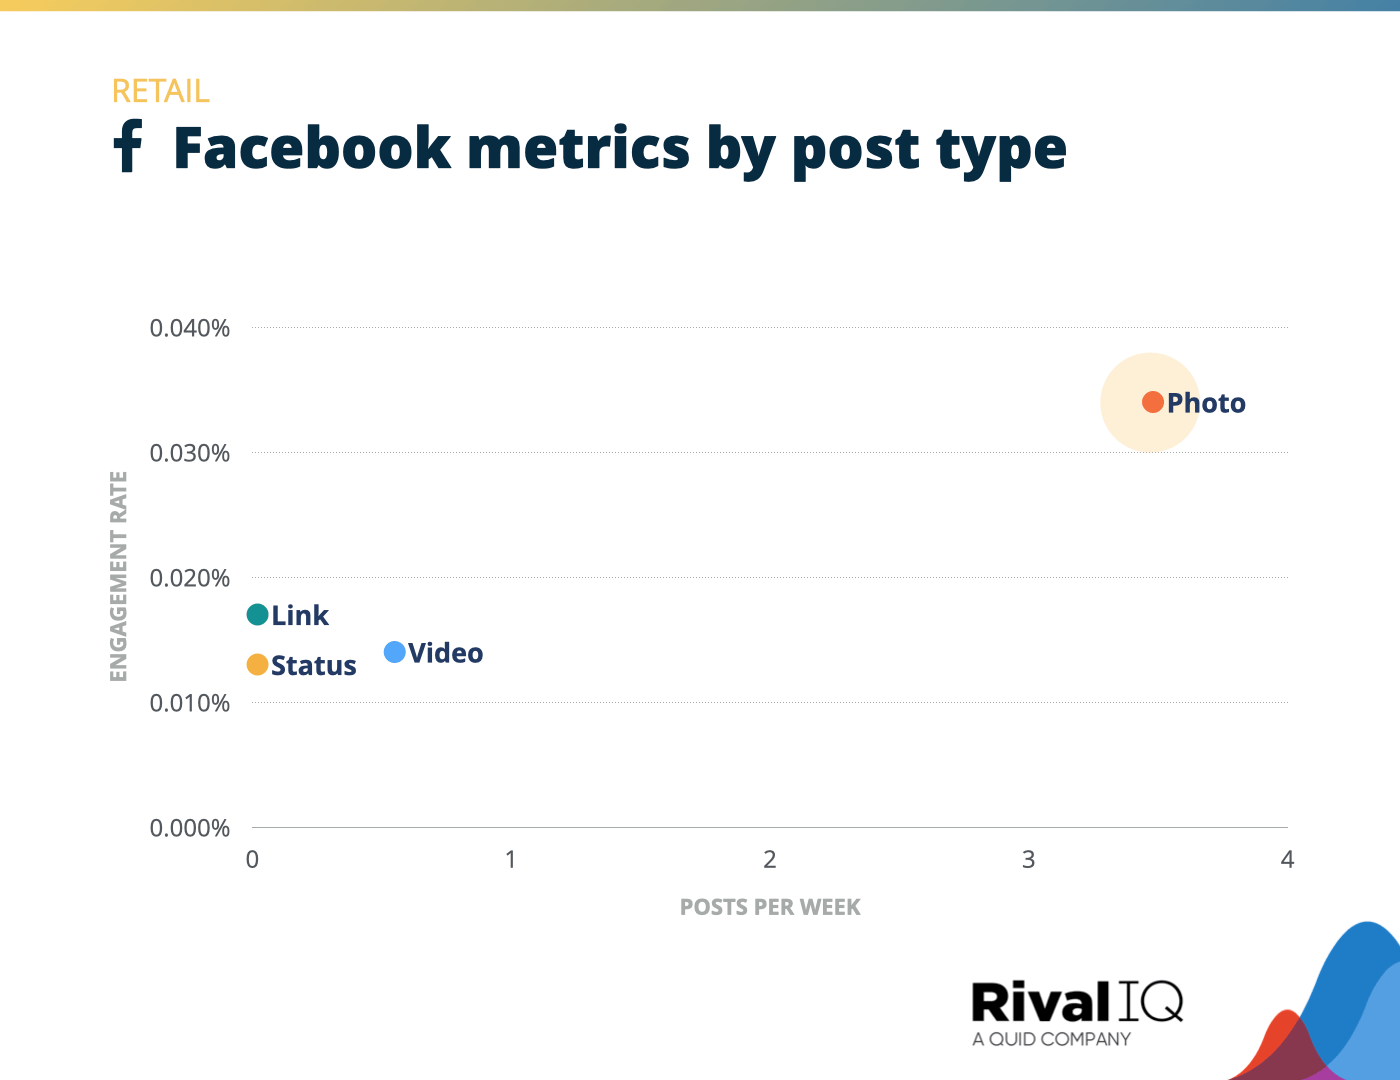
Facebook posts per week and engagement rate by post type, Retail
Photos earned 50% higher engagement rates than the next most engaging post type for Retail brands on Facebook, so this was a smart place to concentrate efforts.
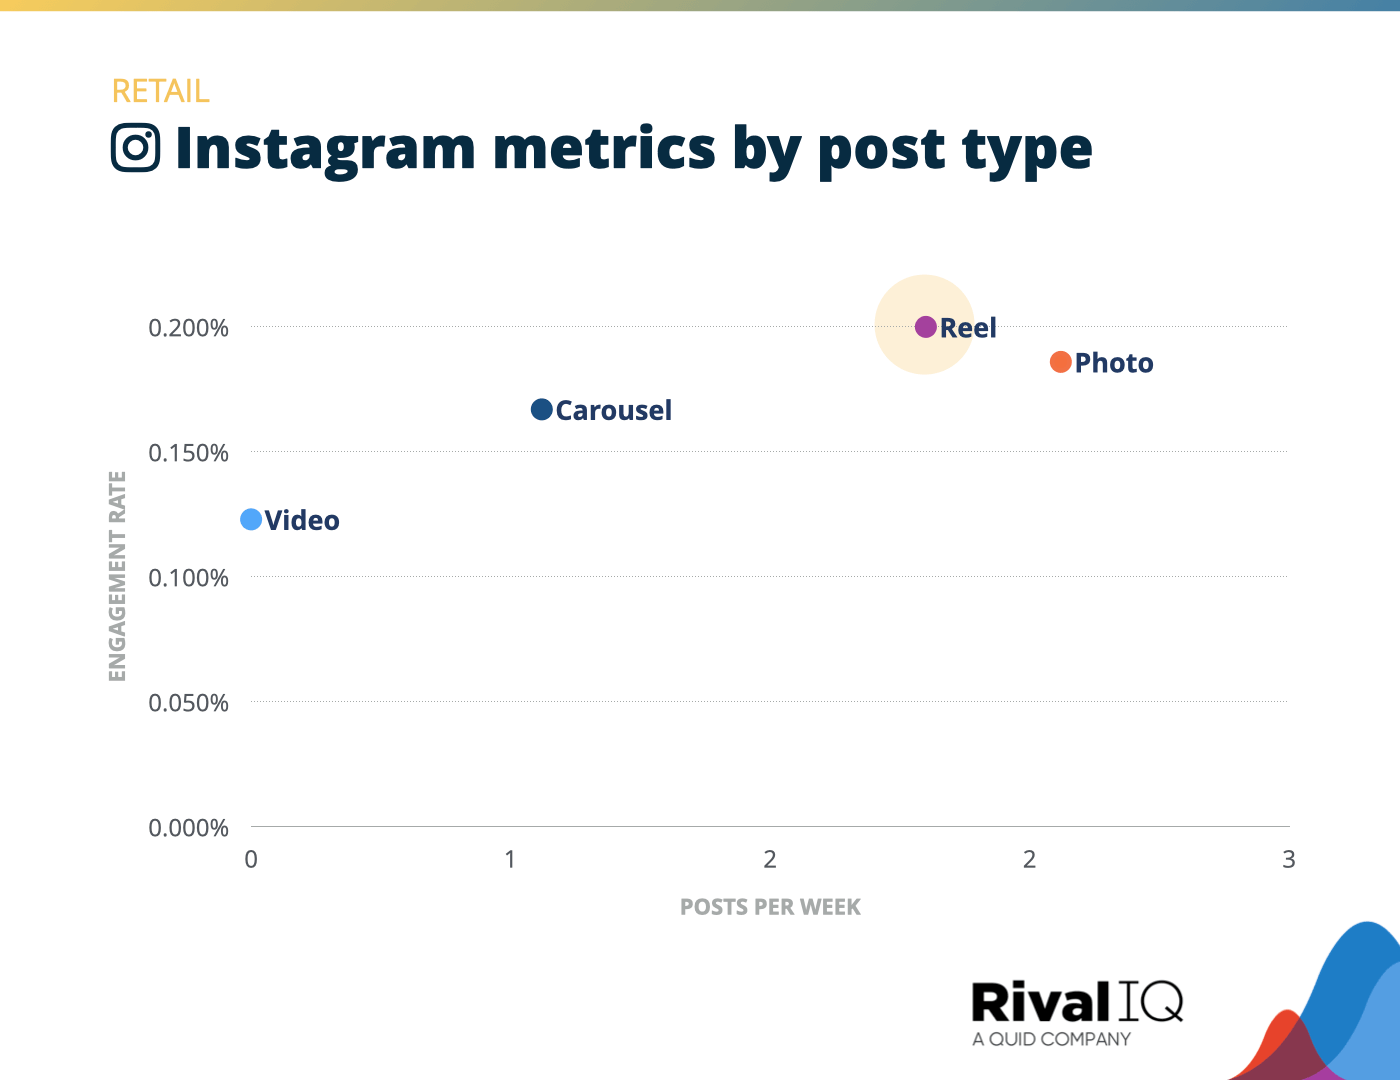
Instagram posts per week and engagement rate by post type, Retail
Reels rocked for Retail brands on Instagram this year and helped Retail brand The Range grab Instagram engagement rate gold.
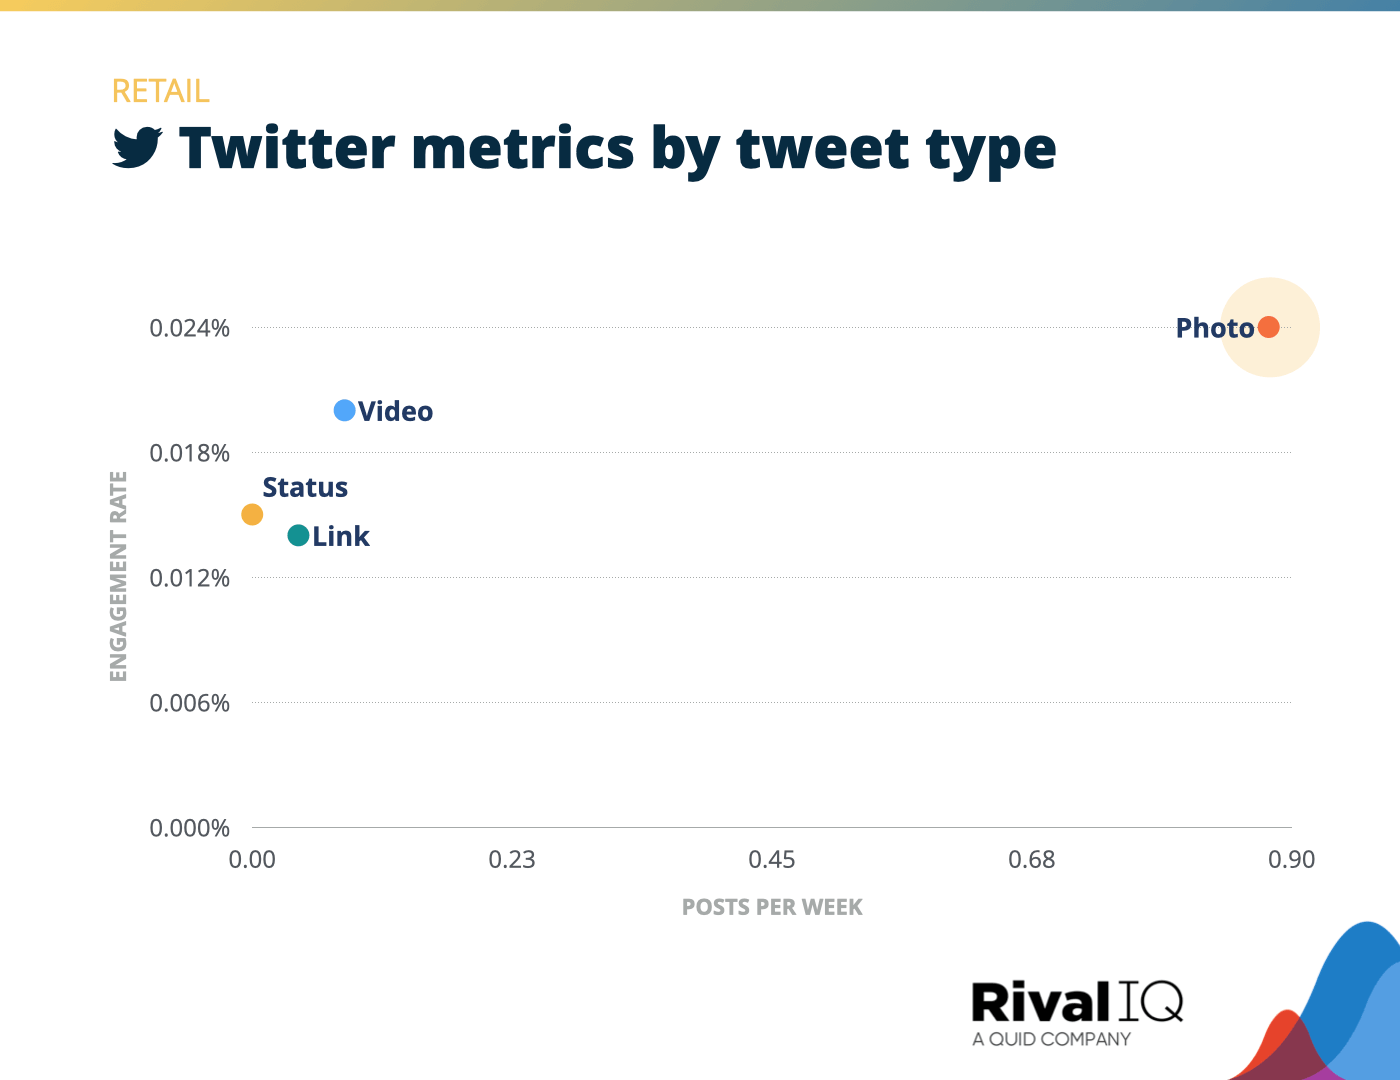
Twitter posts per week and engagement rate by tweet type, Retail
Retail brands saw engagement rates that were about half the all-industry median this year, so leaning into top-performing photo tweets is a strong strategy.
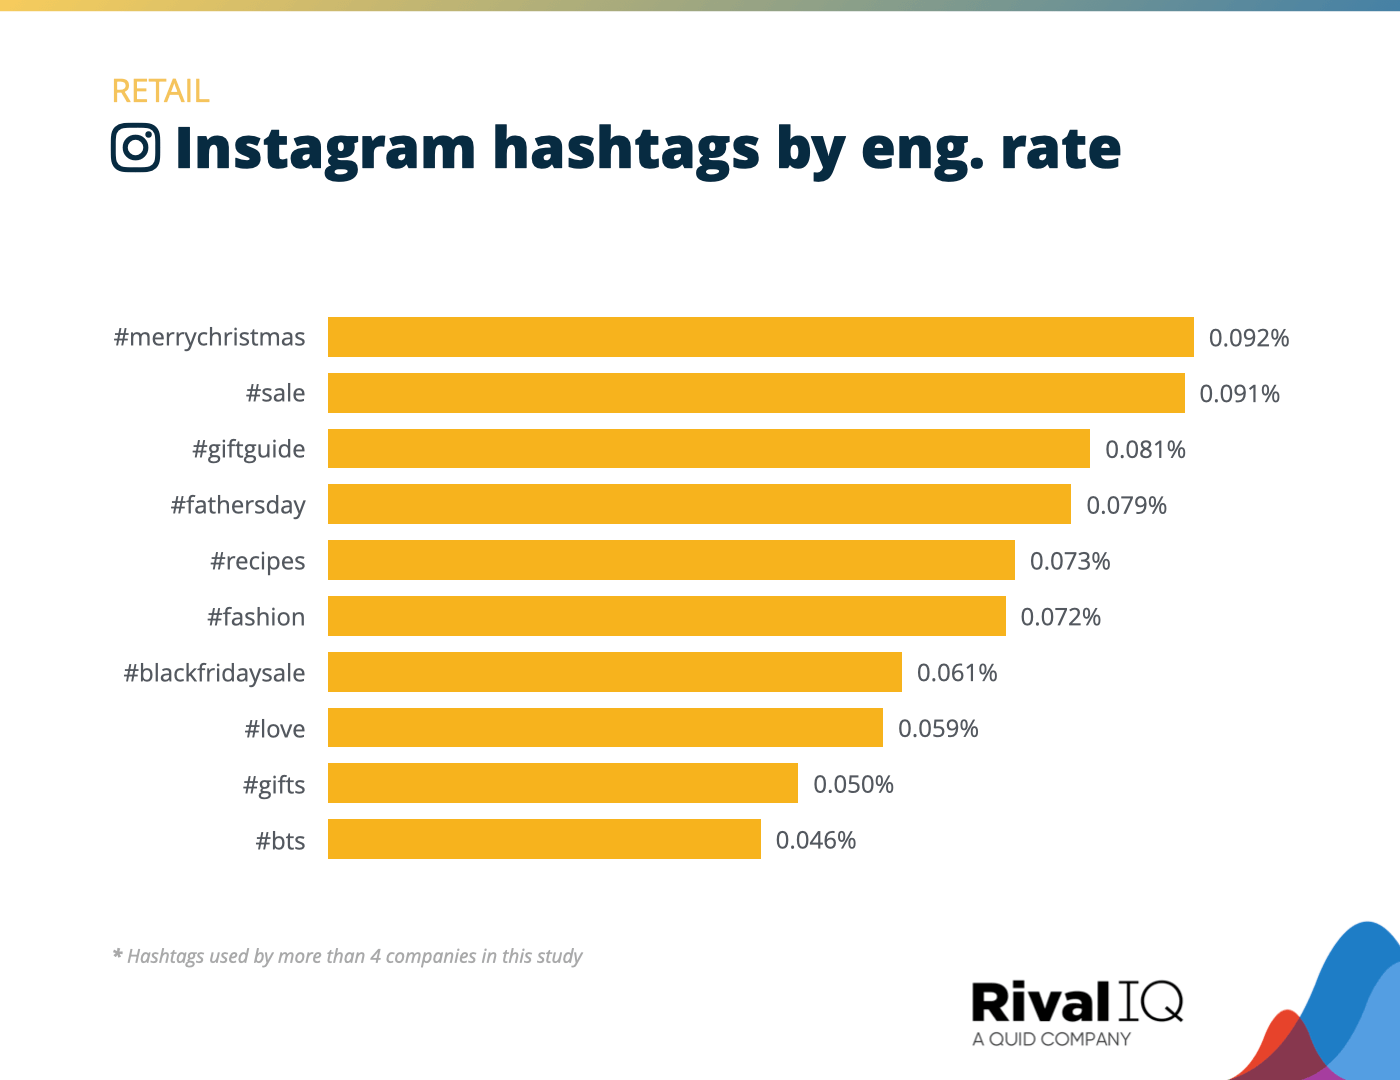
Top Instagram hashtags by engagement rate, Retail
Retail brand hashtags were all about the holidays and other chances to shop like #MerryChristmas and #BlackFridaySale.
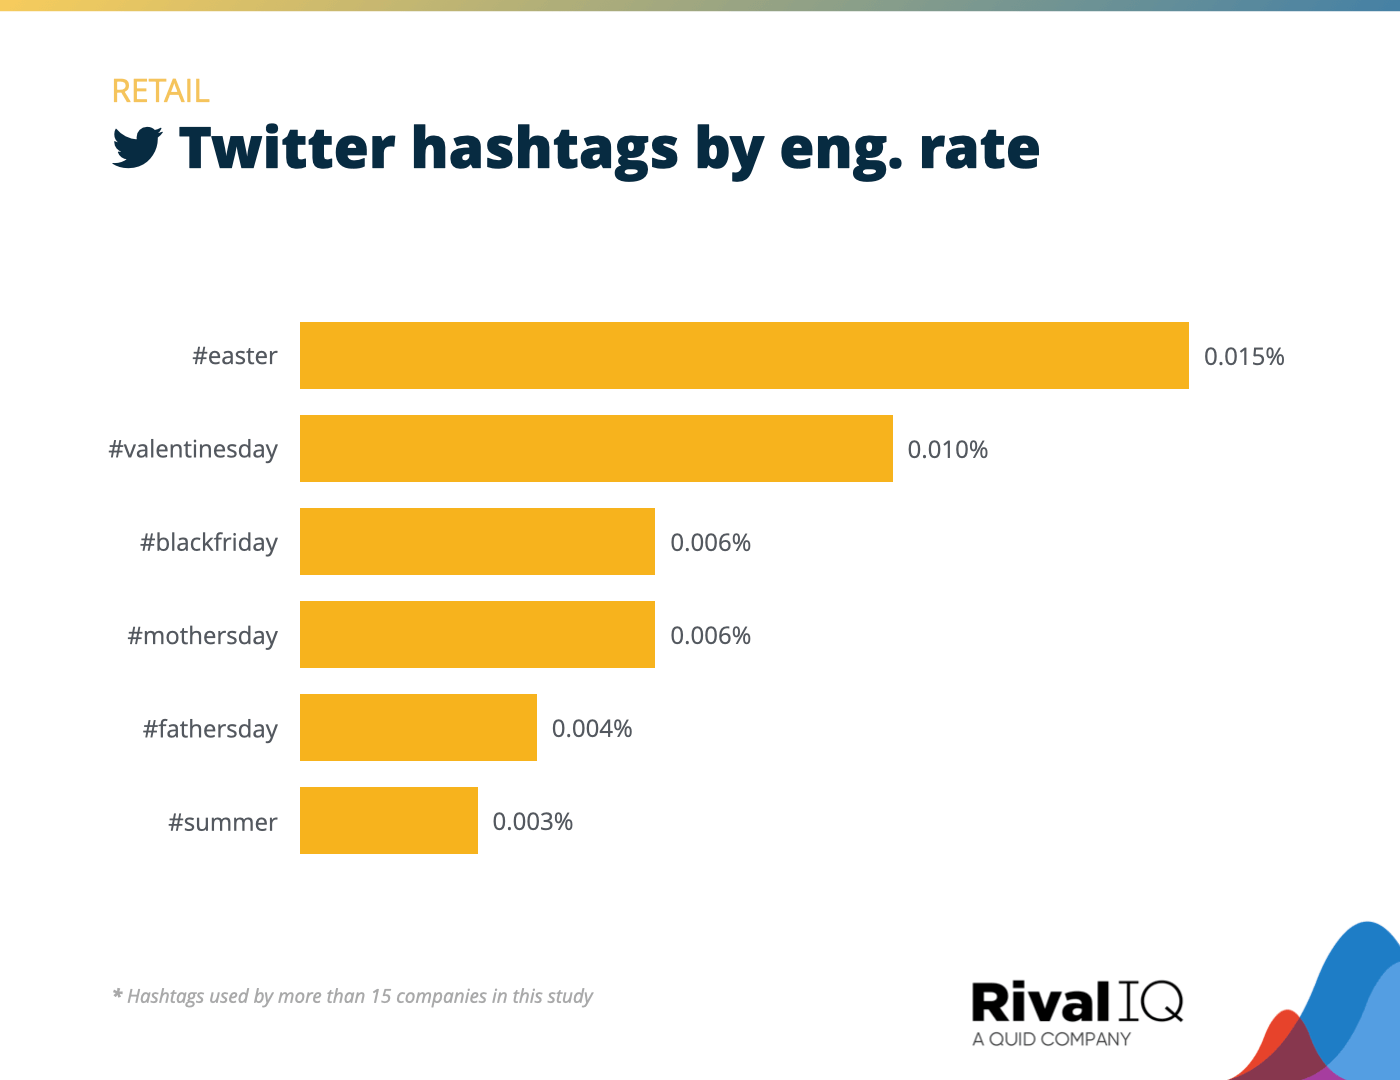
Top Twitter hashtags by engagement rate, Retail
Can you say “shopping opportunity” five times fast? Retail never missed a holiday on Twitter this year, particularly holidays with gifts involved like #ValentinesDay and #MothersDay.
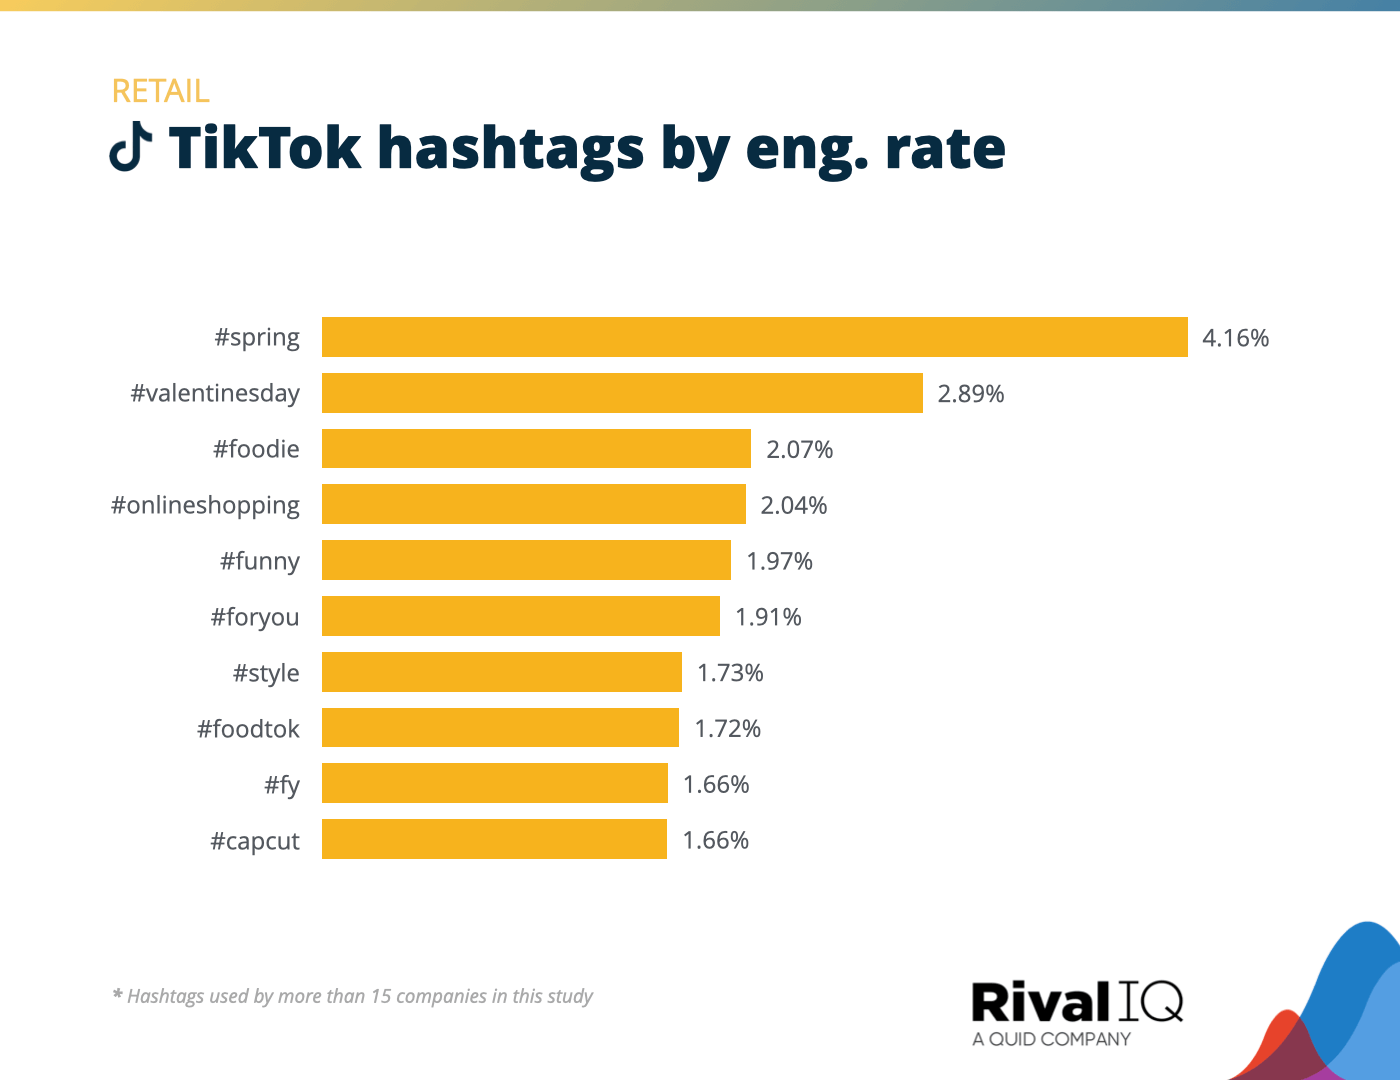
Top TikTok hashtags by engagement rate, Retail
More than a few food hashtags like #foodie and #FoodTok broke through for Retail brands on TikTok this year, suggesting people like to fuel up while they shop.
Sports Teams Social Media Benchmarks
Once again, Sports Teams saw top engagement rates on Facebook and Twitter and were runners-up on Instagram and TikTok. More posting doesn’t always equal more engagements, but it certainly did for Sports Teams this year.
Some ways to improve engagement rates even more:
- Posting early and often is working, so keep it up.
- Followers love a throwback, so keep using hashtags like #OnThisDay and #TBT to remind fans of the GOATs of yore.
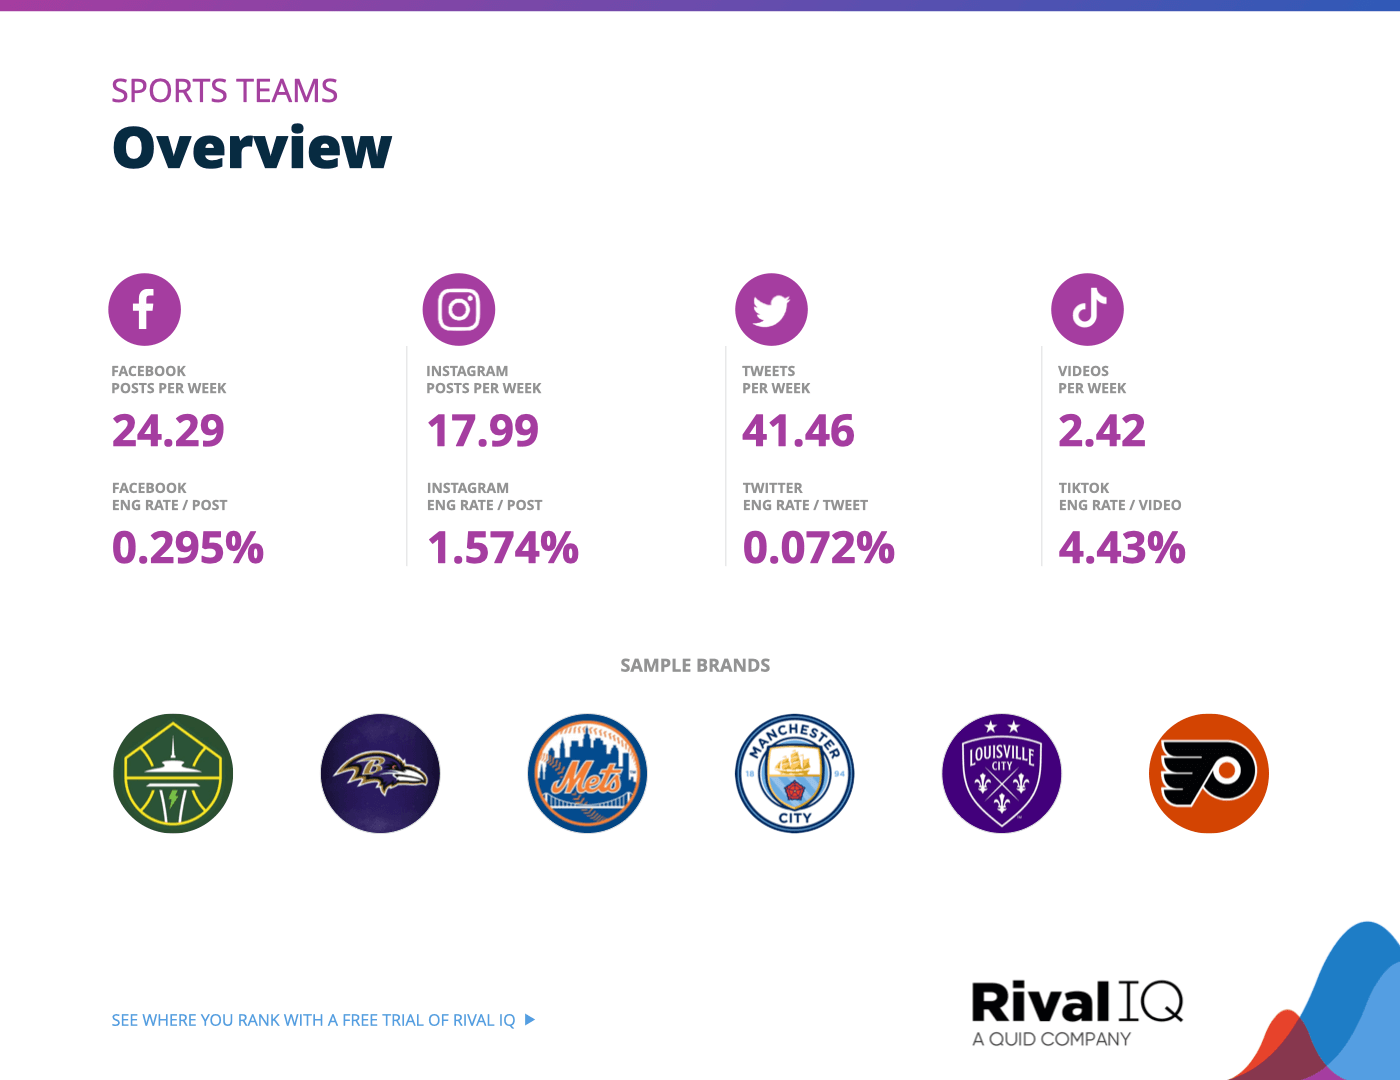
Overview of all benchmarks, Sports Teams
Notable brands in this year’s report include The Philadelphia Flyers, Louisville FC, Manchester City FC, The New York Mets, the Baltimore Ravens, and the Seattle Storm.
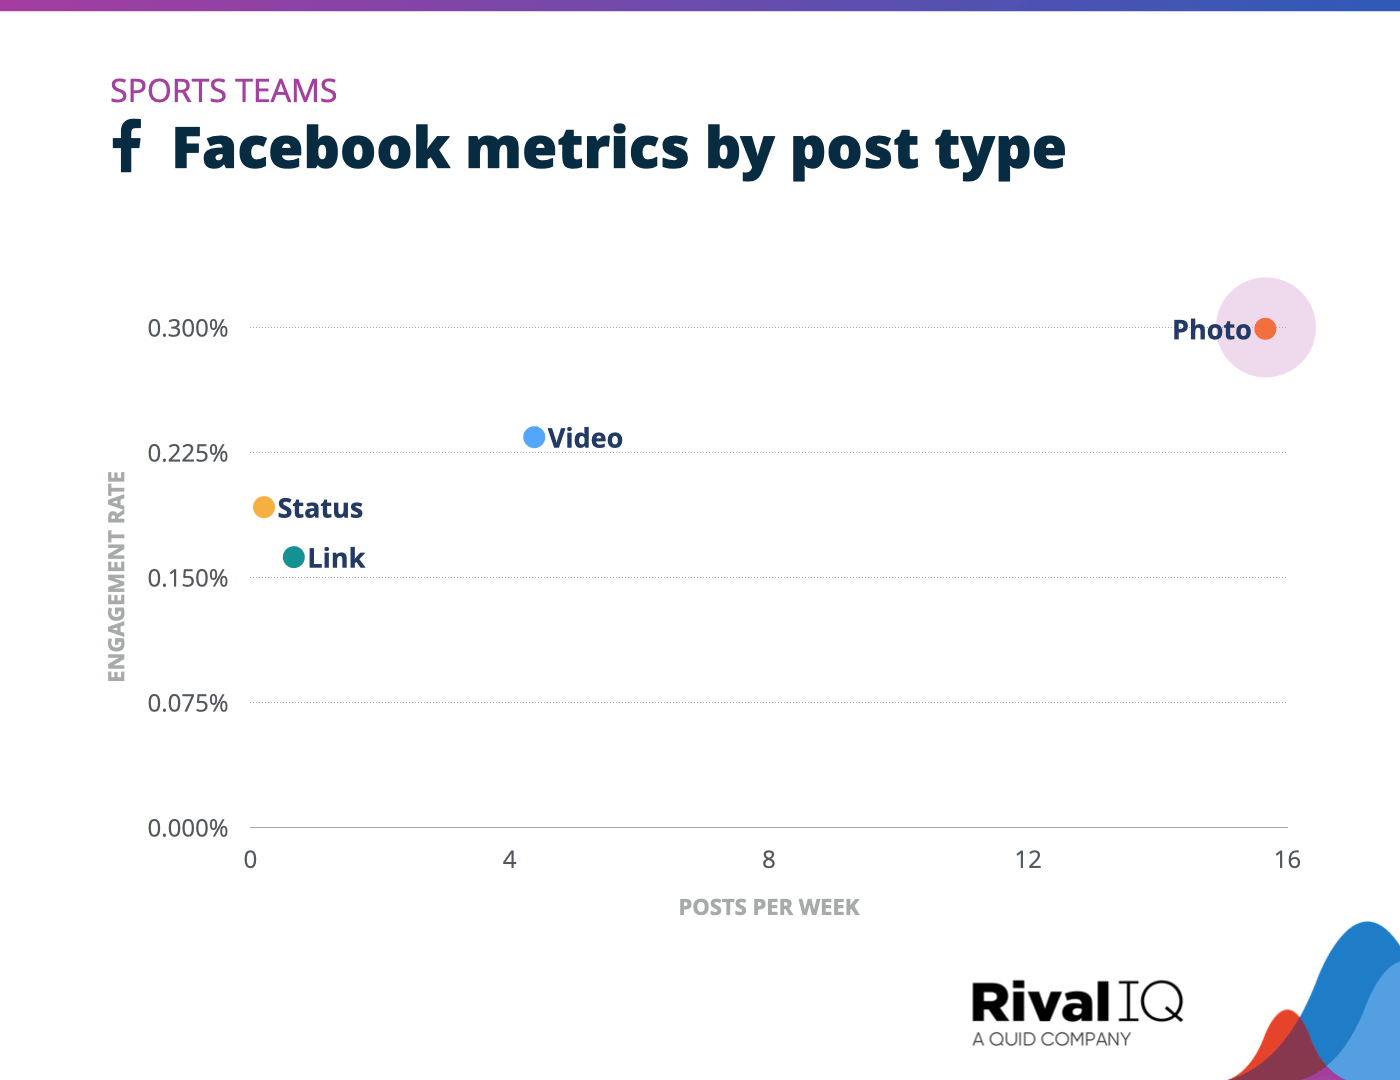
Facebook posts per week and engagement rate by post type, Sports Teams
Photo posts helped Sports Teams earn nearly 5x the median engagement rate on Facebook, putting these brands comfortably in first place.
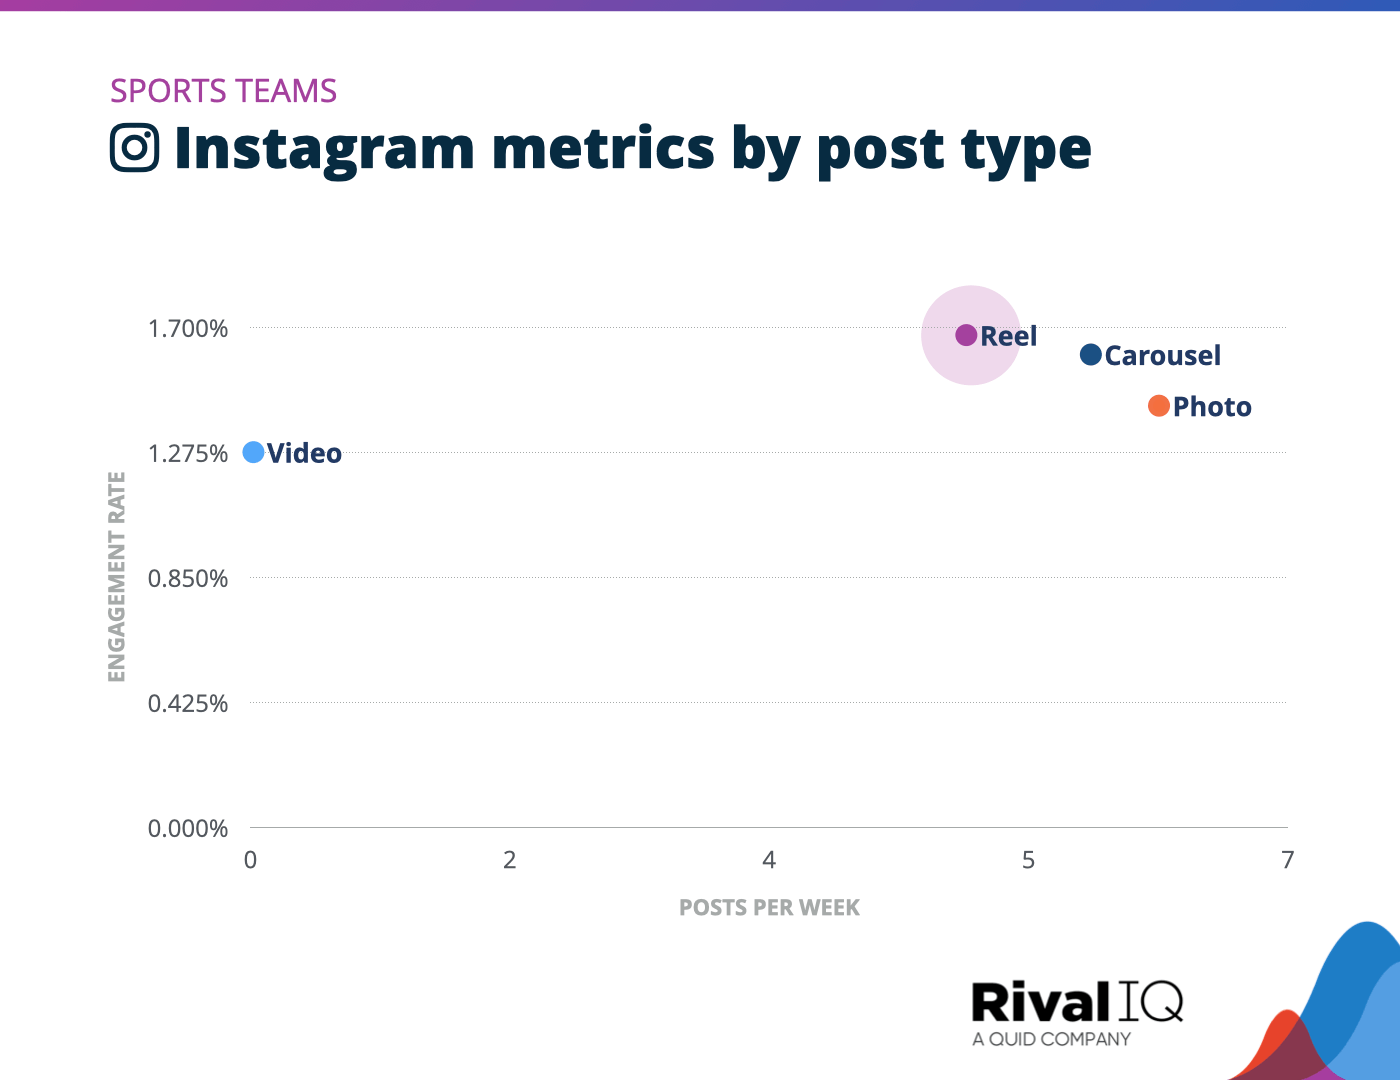
Instagram posts per week and engagement rate by post type, Sports Teams
Reels, Carousels, and Photo posts were all neck and neck for the top post type for Sports Teams on Instagram this year, with Reels coming out just ahead.
AEK Athens FC had the highest engagement rate on Instagram of any Sports Team we studied.
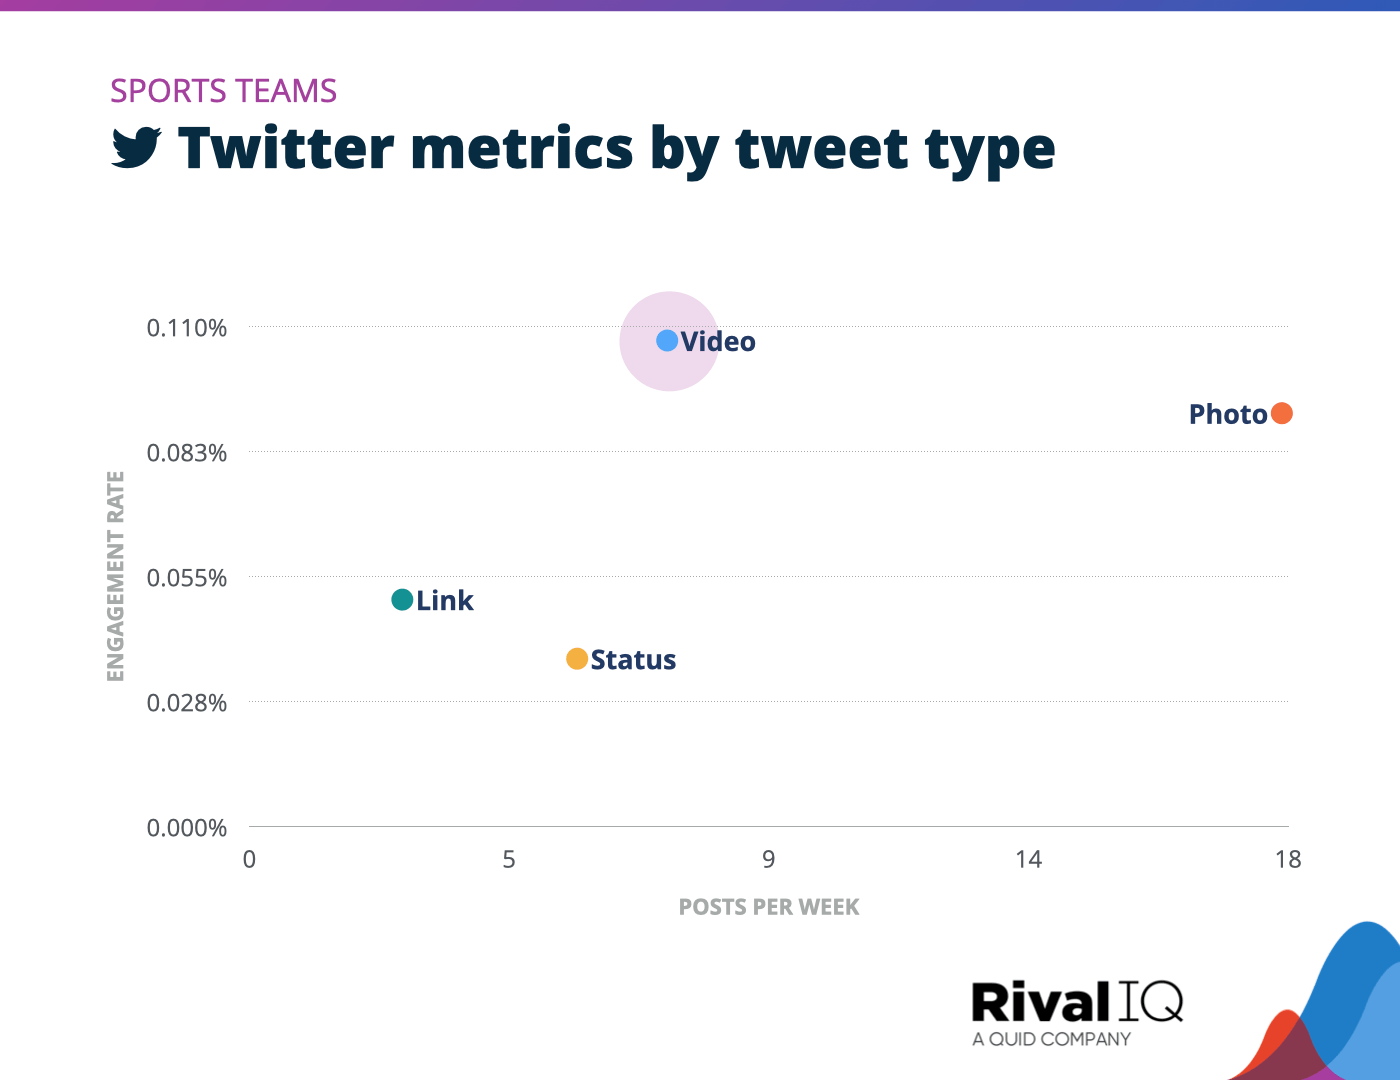
Twitter posts per week and engagement rate by tweet type, Sports Teams
Videos were all the rage for Sports Teams on Twitter this year, unlike most other industries who did best with photo tweets.
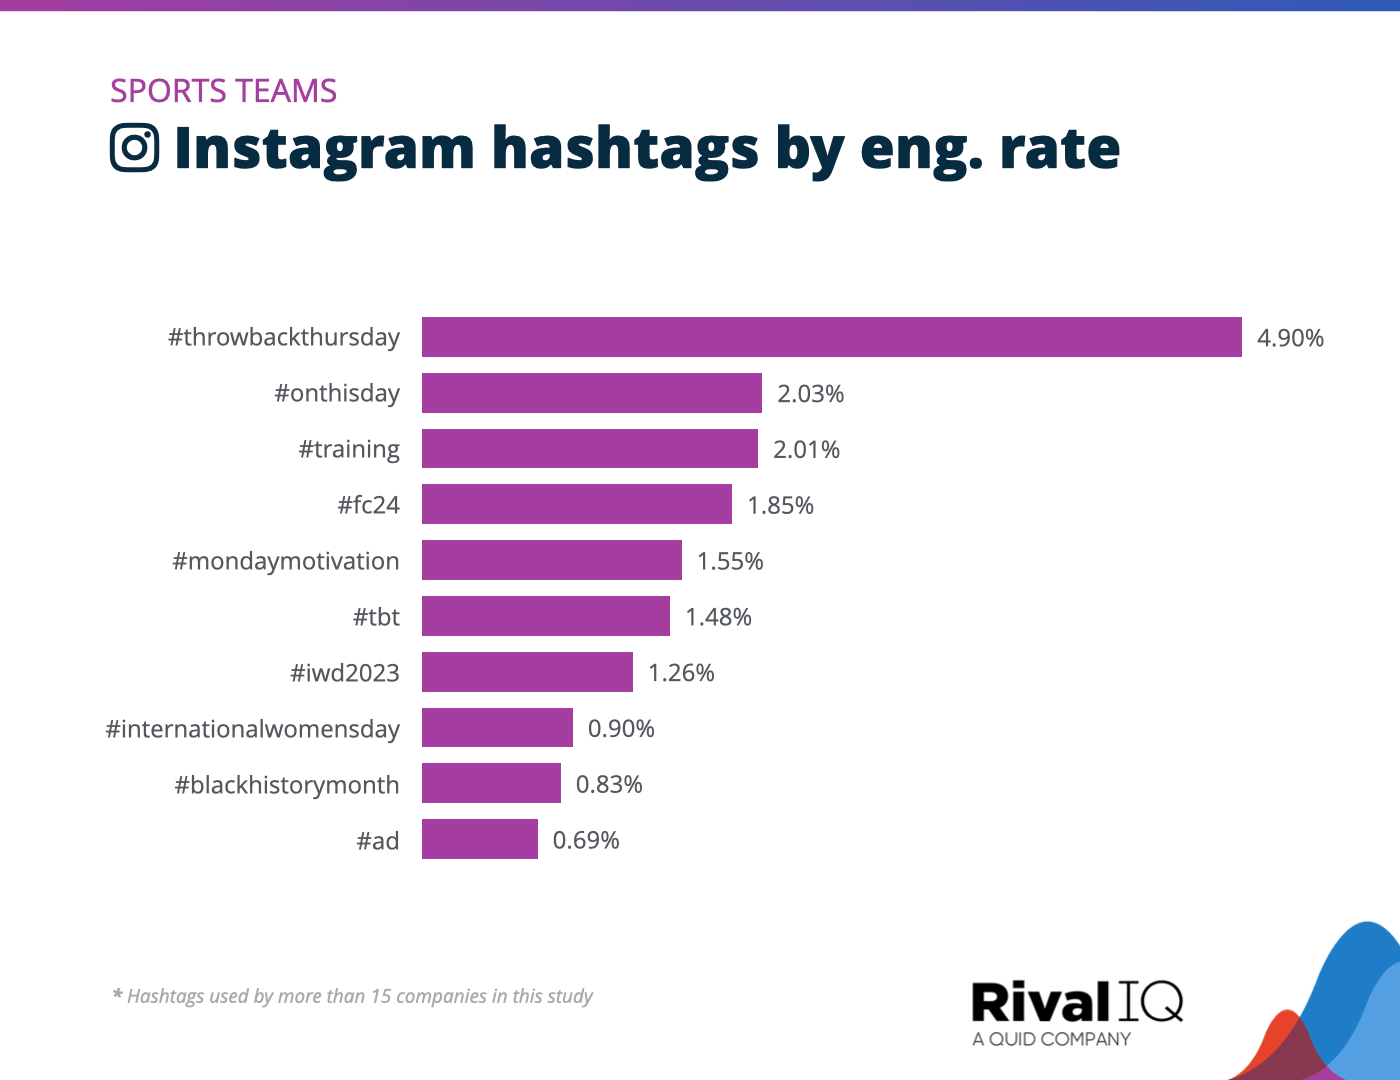
Top Instagram hashtags by engagement rate, Sports Teams
Sports Teams were all about the olden days on Instagram this year, with hashtags like #ThrowbackThursday and #OnThisDay reminding fans of the all-time greats.
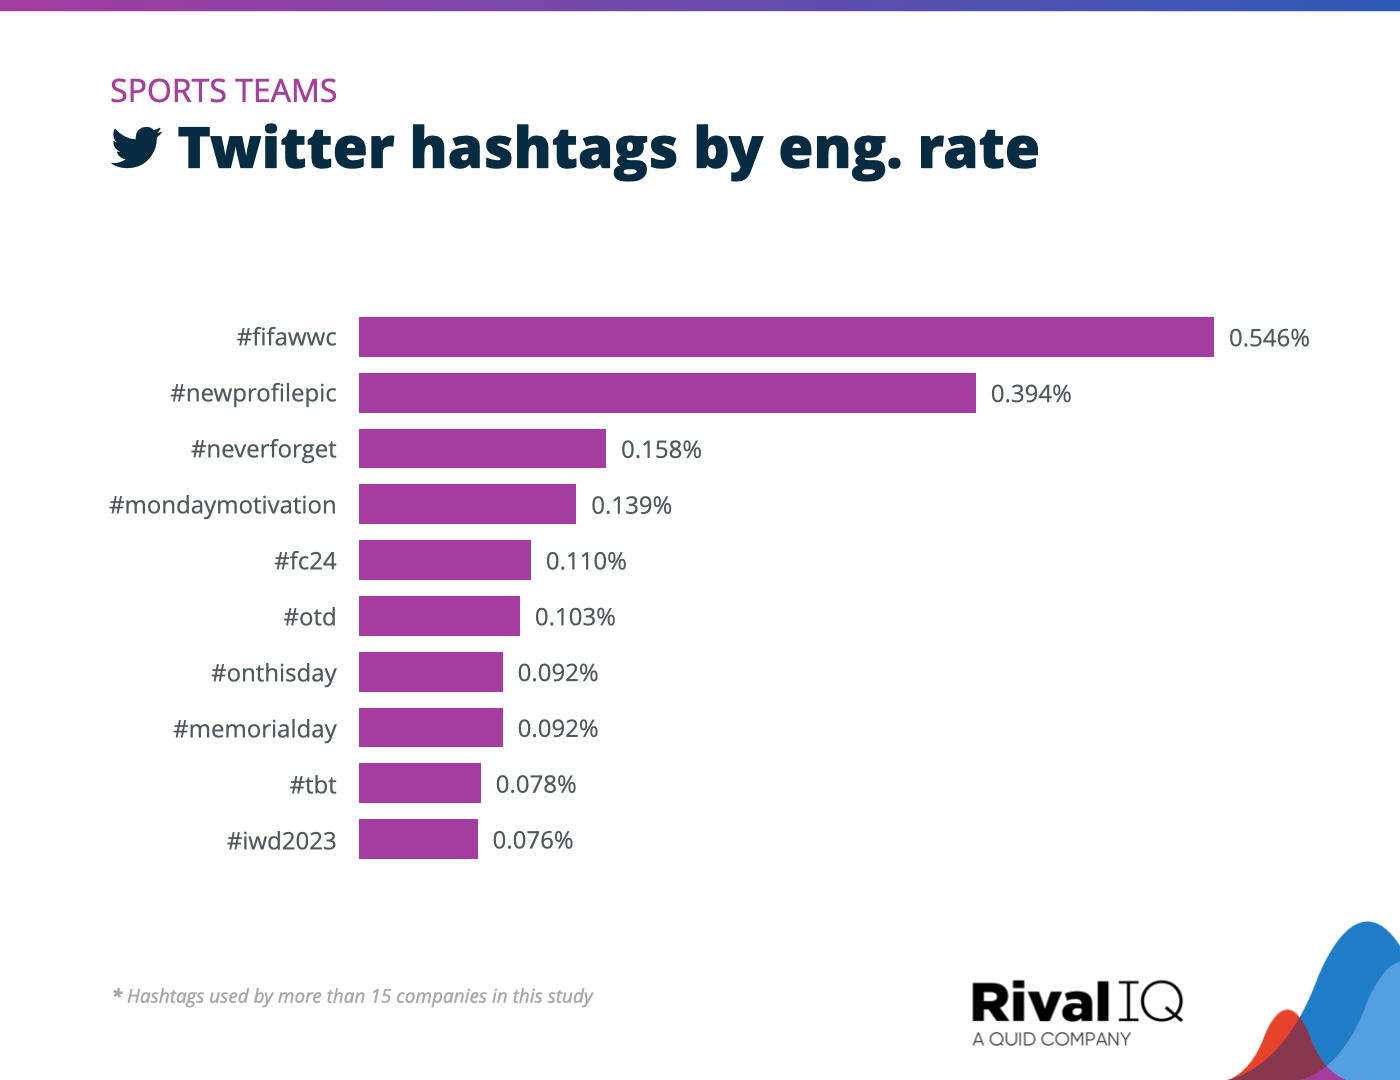
Top Twitter hashtags by engagement rate, Sports Teams
Just like on Twitter, Sports Teams loved a good throwback on Twitter this year with hashtags like #OnThisDay and #TBT.
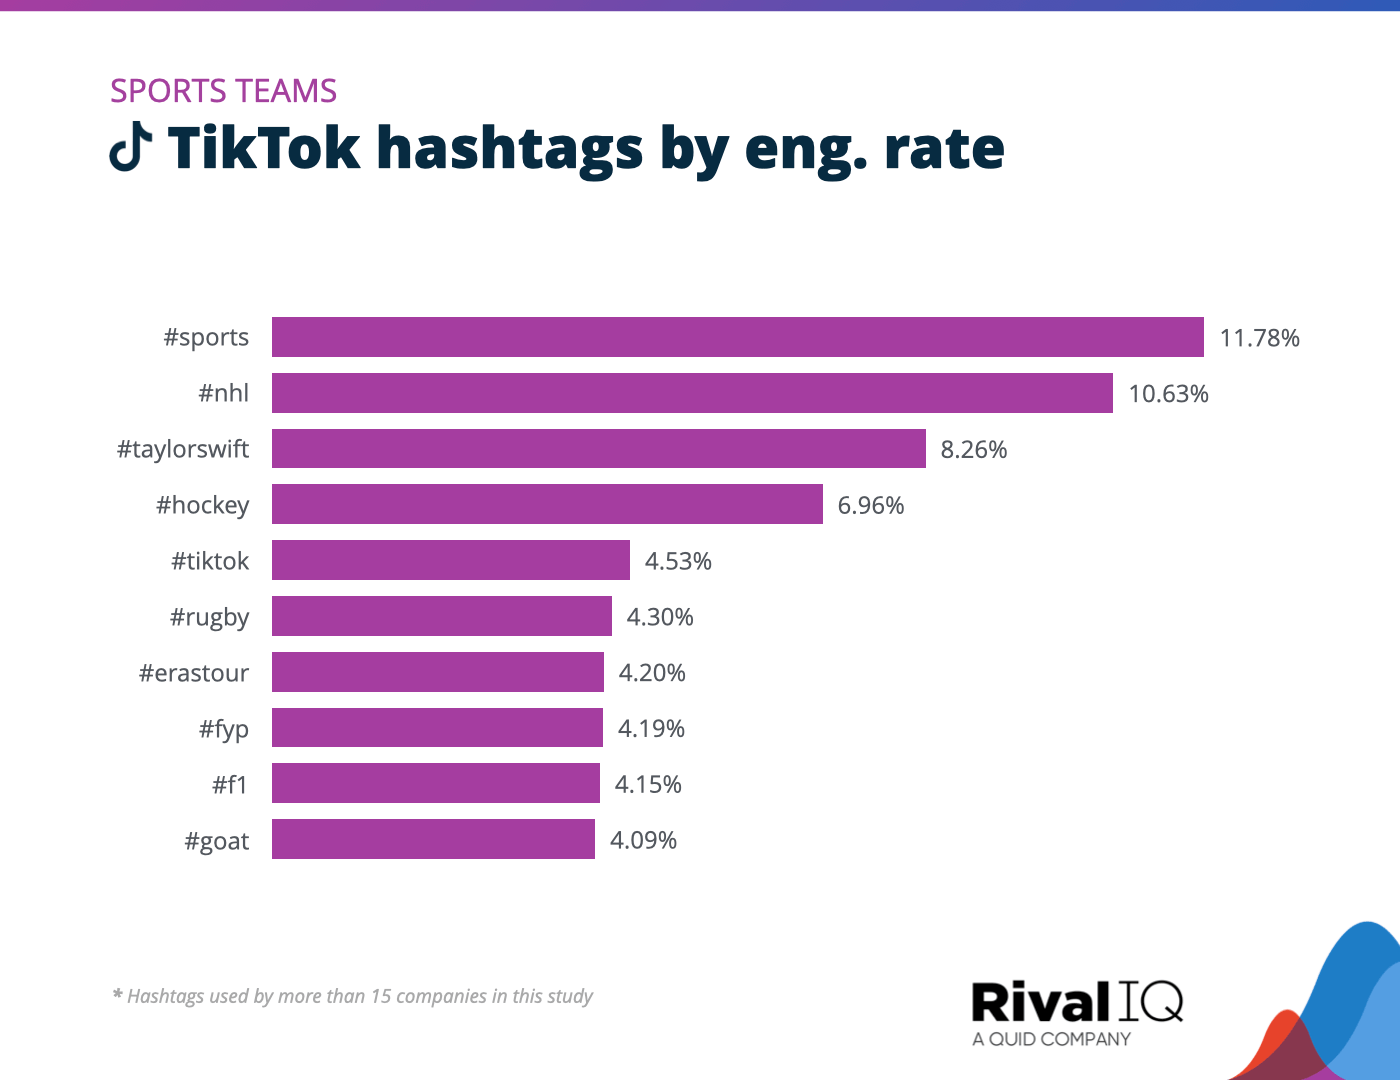
Top TikTok hashtags by engagement rate, Sports Teams
Anybody with a smartphone knows you couldn’t say “trend” without Taylor Swift on social this year, so it’s no surprise Taylor-themed hashtags were trending for Sports Teams.
Tech & Software Social Media Benchmarks
Tech & Software brands earned median engagement rates on Instagram and Twitter while struggling on Facebook and TikTok.
Here are two ideas for improving engagement rates:
- Experiment with post types to go beyond the photo posts.
- Holidays like #MayThe4thBeWithYou and #InternationalWomensDay were runaway faves with Tech & Software followers looking to nerd out and/or support women in the industry.
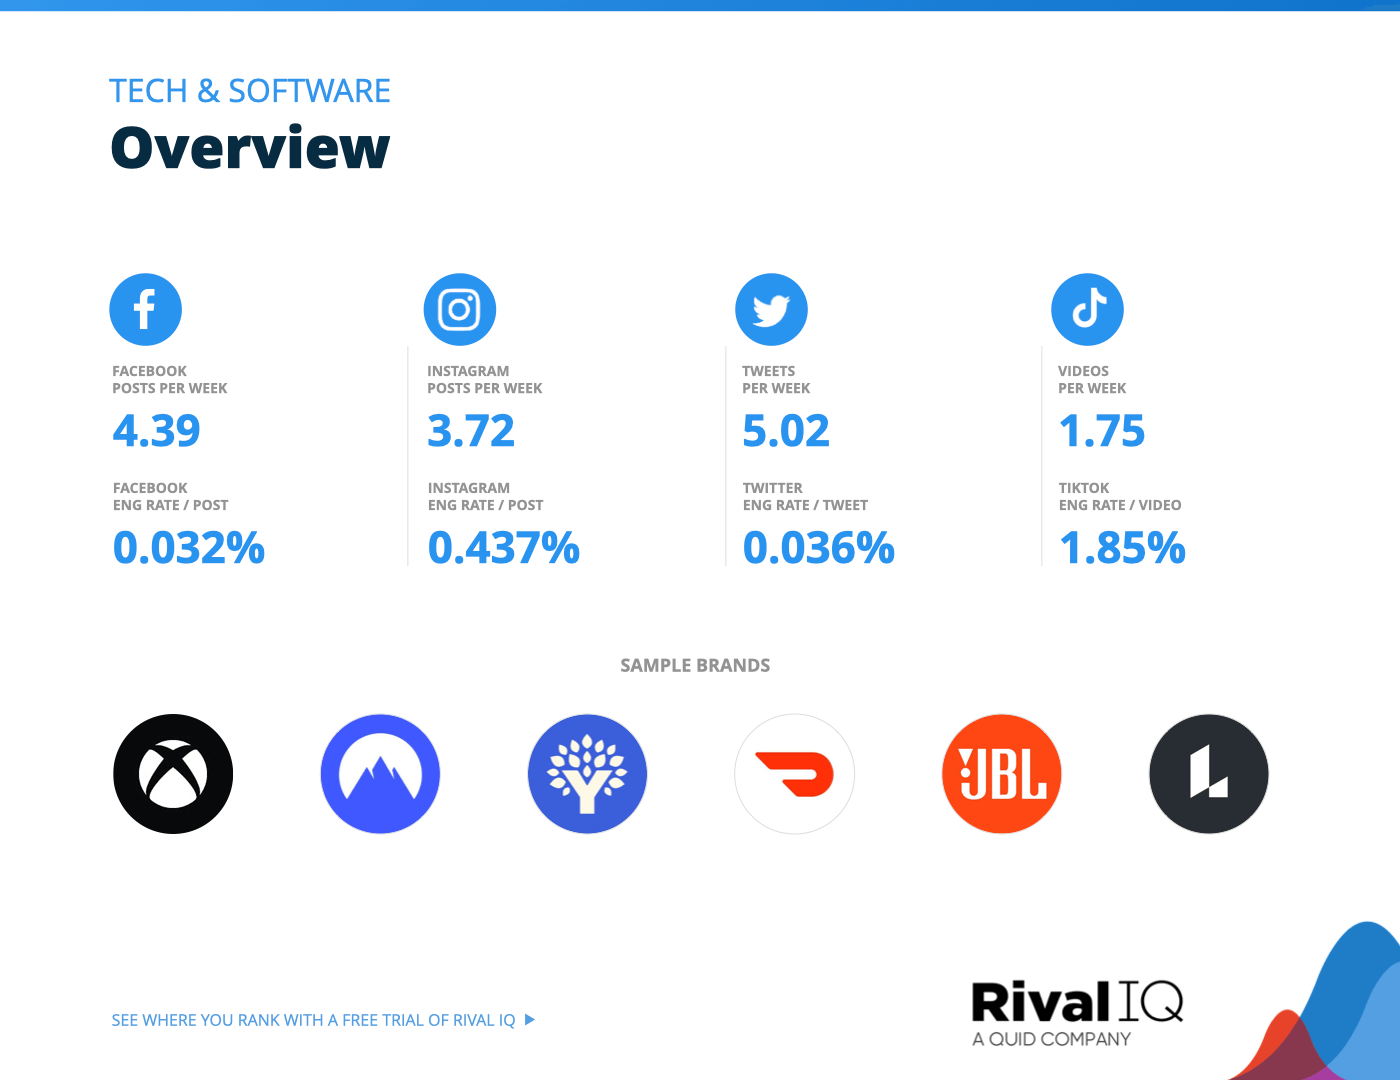
Overview of all benchmarks, Tech & Software
Notable brands in this year’s report include Doordash, JBL, Lucid Technologies, NordVPN, Xbox, and You Need A Budget.
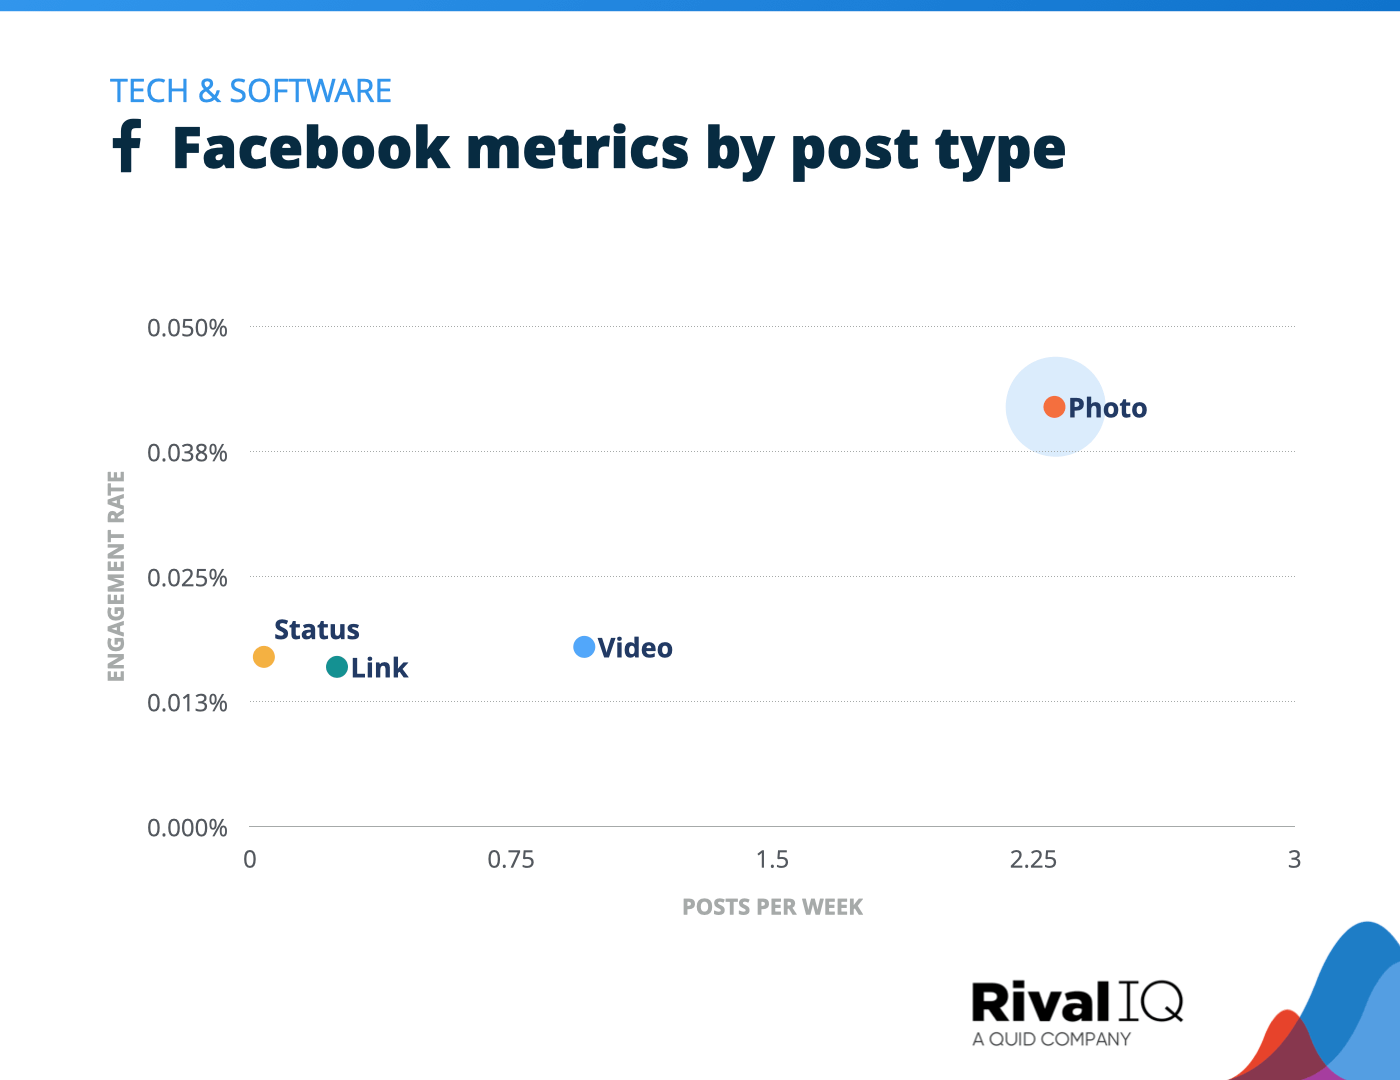
Facebook posts per week and engagement rate by post type, Tech & Software
Photos grabbed great engagement rates on Facebook for Tech & Software brands like electronics company Sharp.
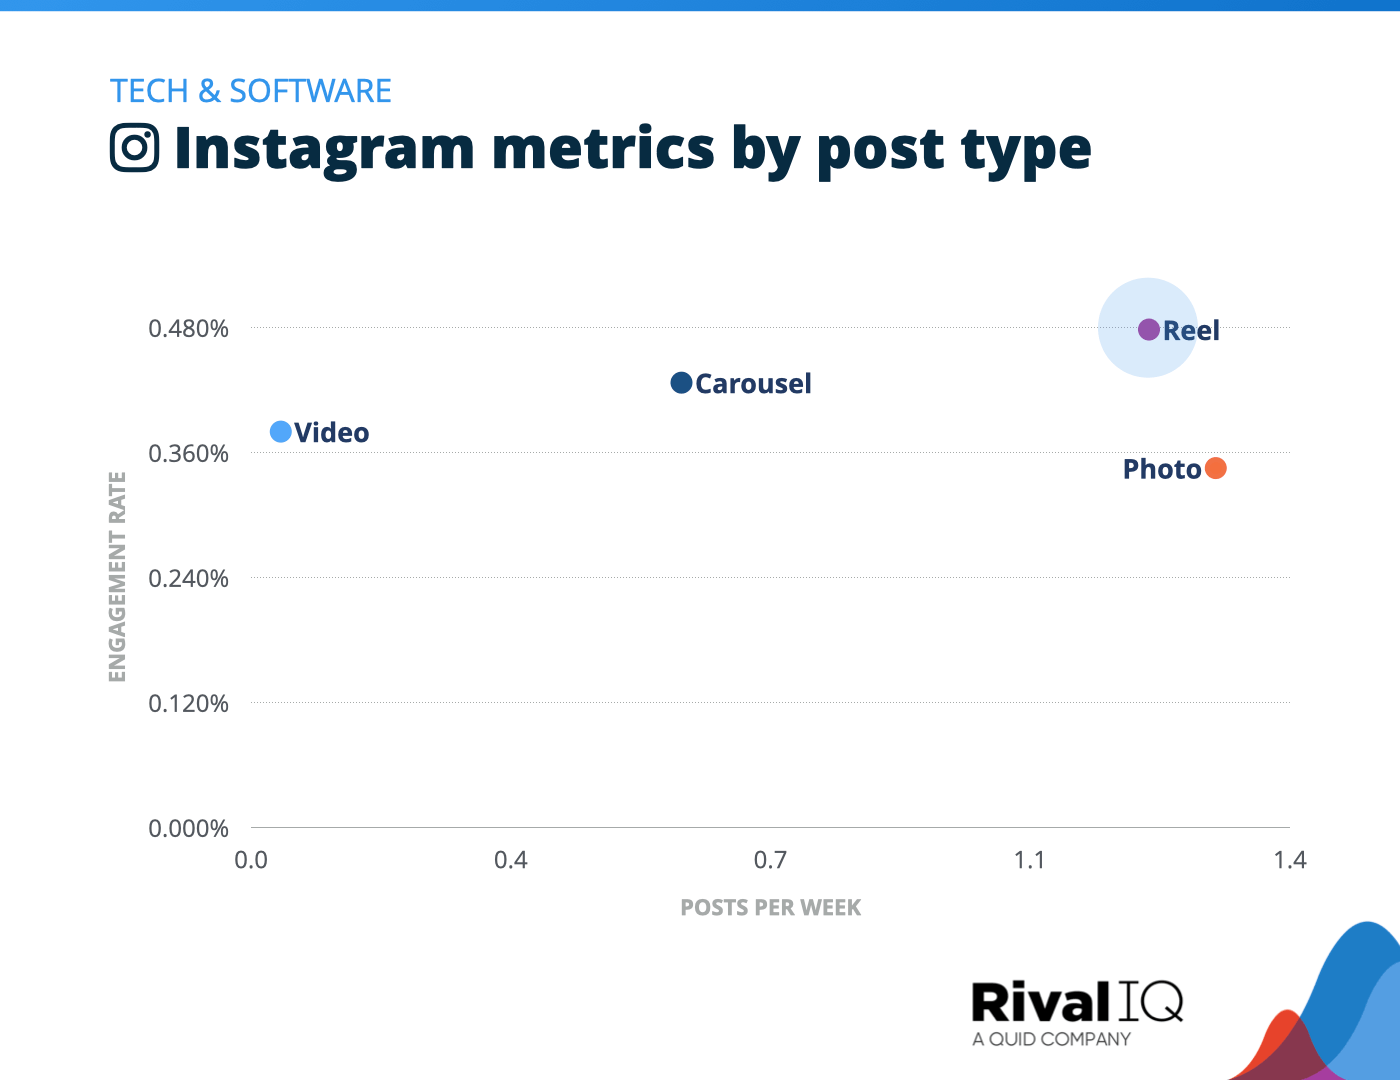
Instagram posts per week and engagement rate by post type, Tech & Software
Like many other industries in this study, Reels topped the charts for Tech & Software brands on Instagram this year.
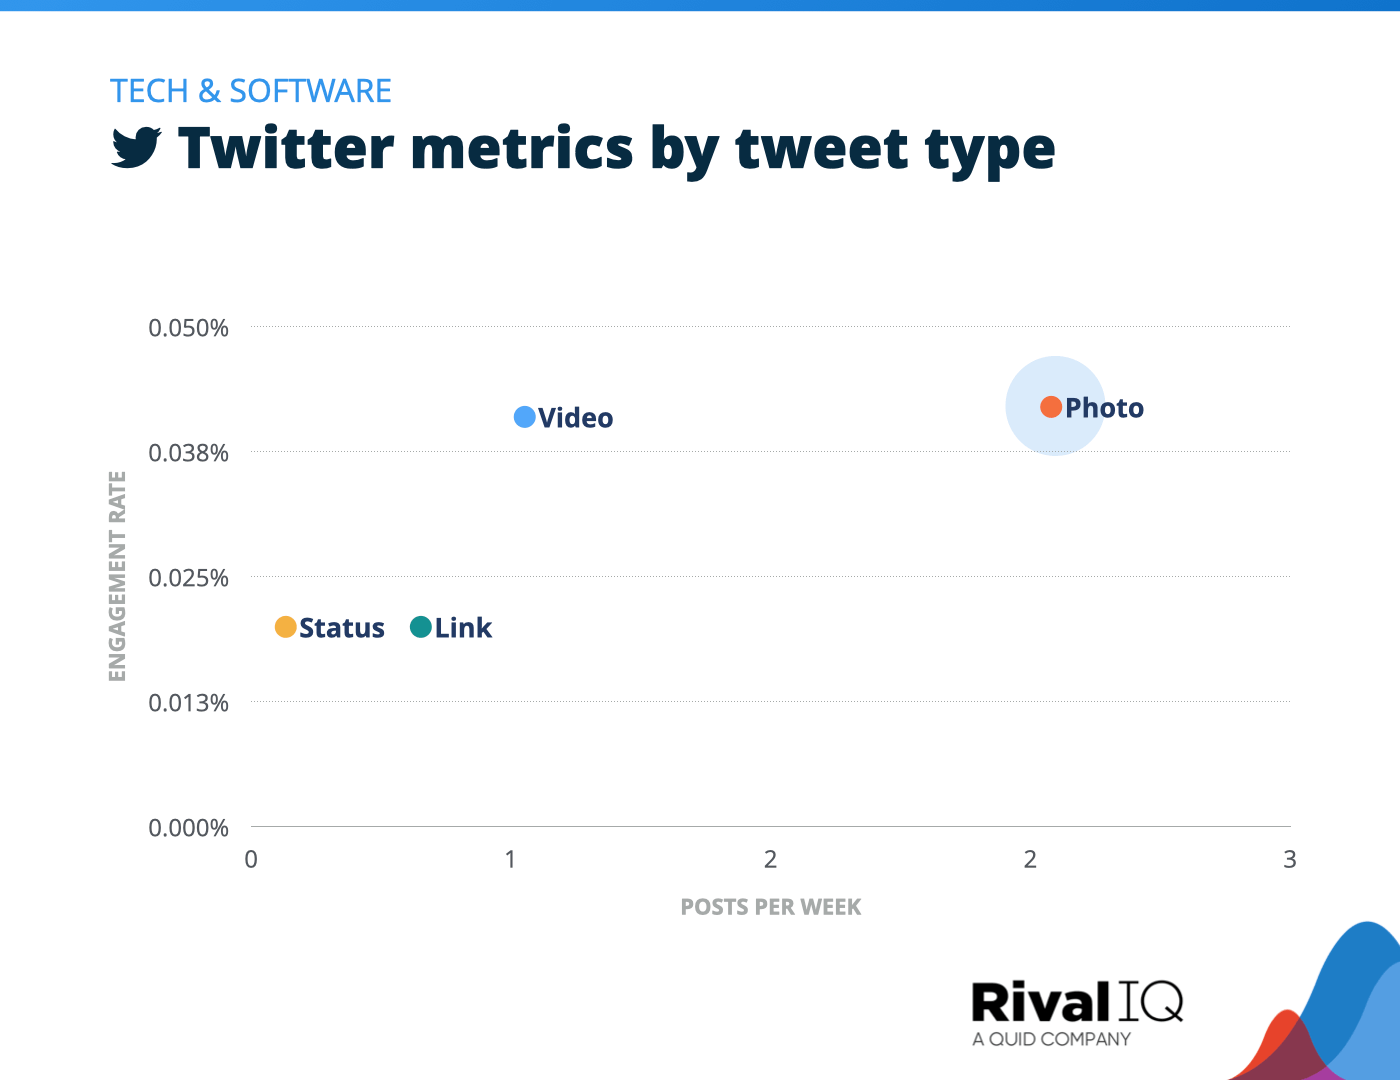
Twitter posts per week and engagement rate by tweet type, Tech & Software
Photo tweets beat out every other type by both engagement rate and frequency for Tech & Software brands this year.
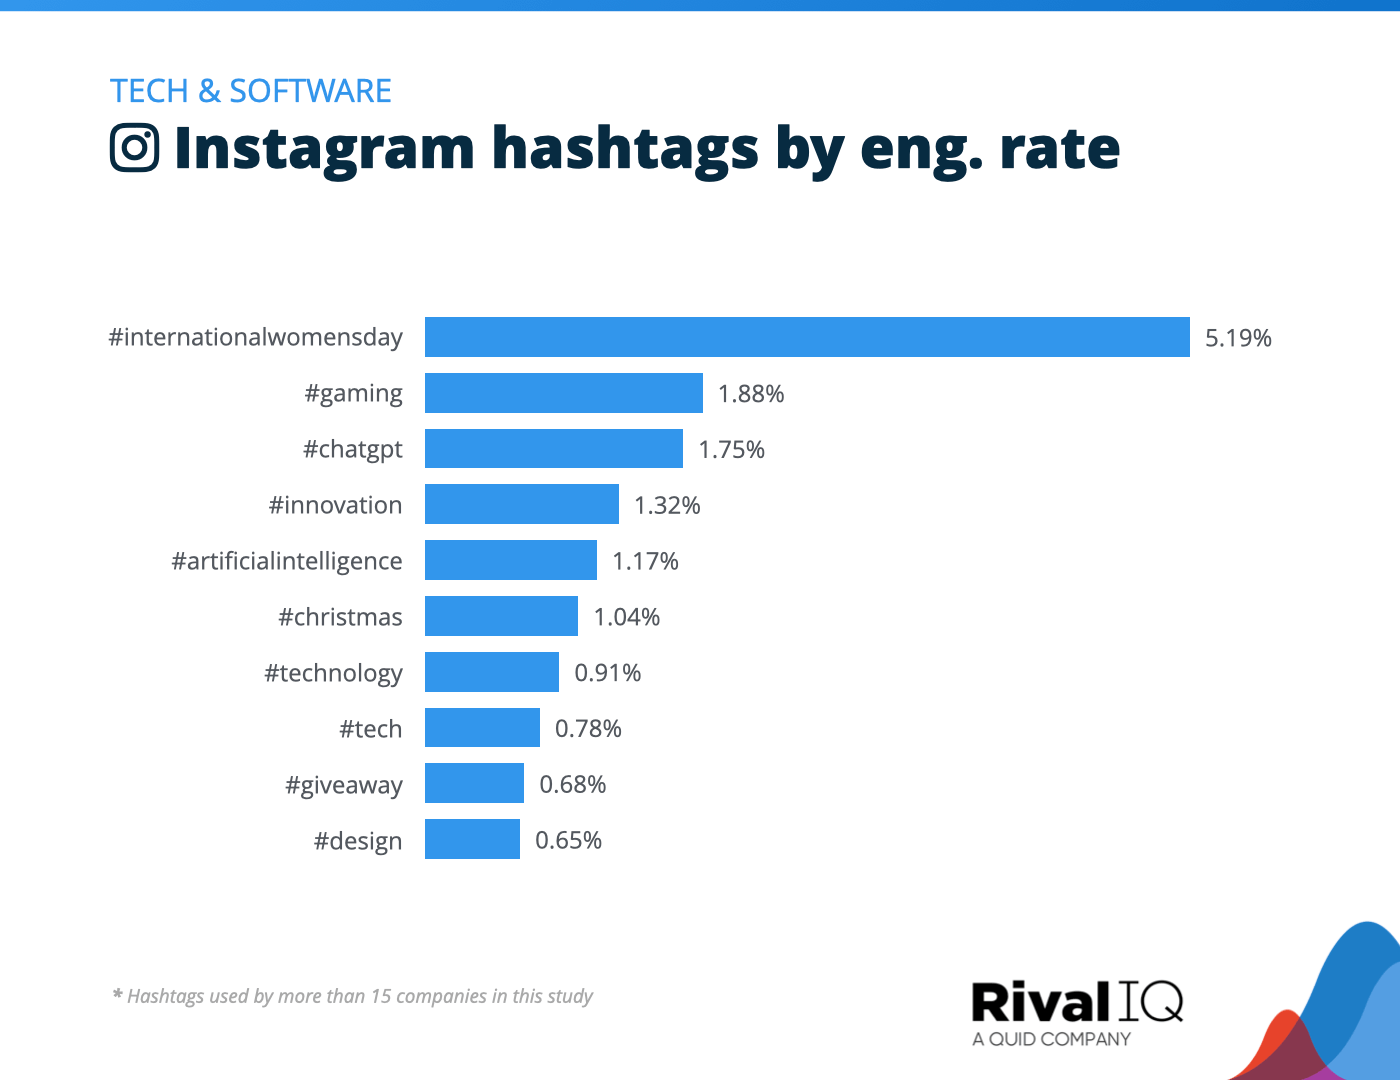
Top Instagram hashtags by engagement rate, Tech & Software
Posting about #InternationalWomensDay was a slam dunk for Tech & Software brands on Instagram this year.
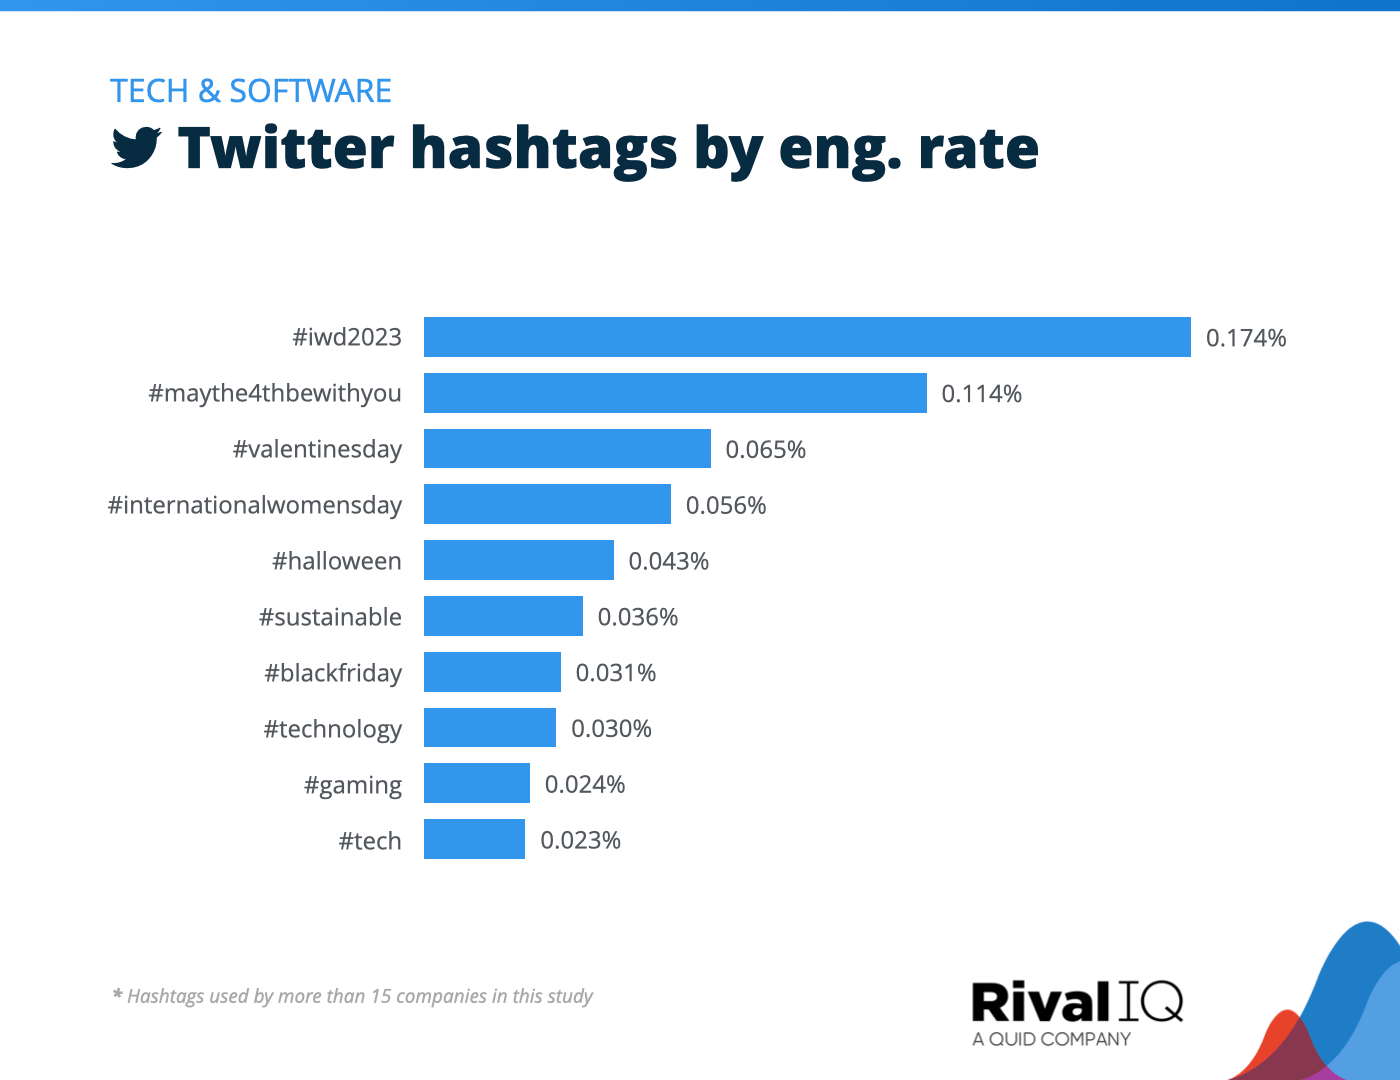
Top Twitter hashtags by engagement rate, Tech & Software
Tech & Software brands never miss the chance to celebrate everyone’s favorite nerd holiday with the #MayThe4thBeWithYou hashtag.
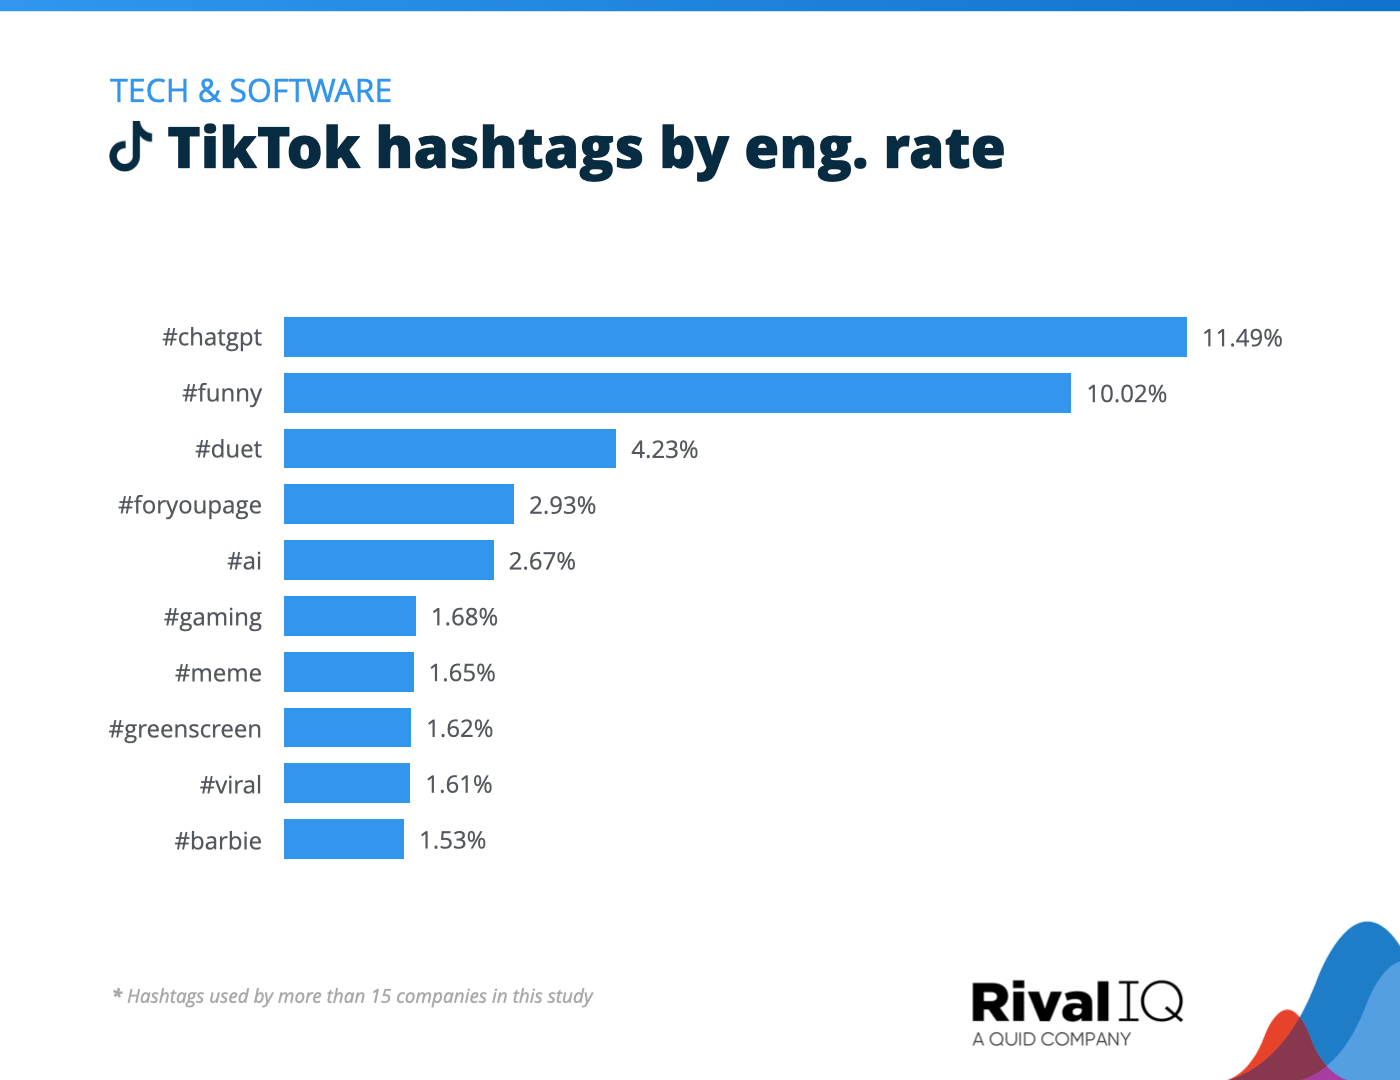
Top TikTok hashtags by engagement rate, Tech & Software
AI-themed hashtags like #ChatGPT and #AI topped the Tech & Software charts on TikTok this year.
Travel Social Media Benchmarks
Travel brands earned above-media engagement rates on Facebook and TikTok while running in the middle of the pack on Instagram and Twitter.
A few suggestions to grow engagement:
- Luxury and destination hashtags performed especially well for Travel brands this year.
- Posting frequency was below-median across the board, so experiment with an uptick here to see if you can increase your current engagement rates without sacrificing content quality.
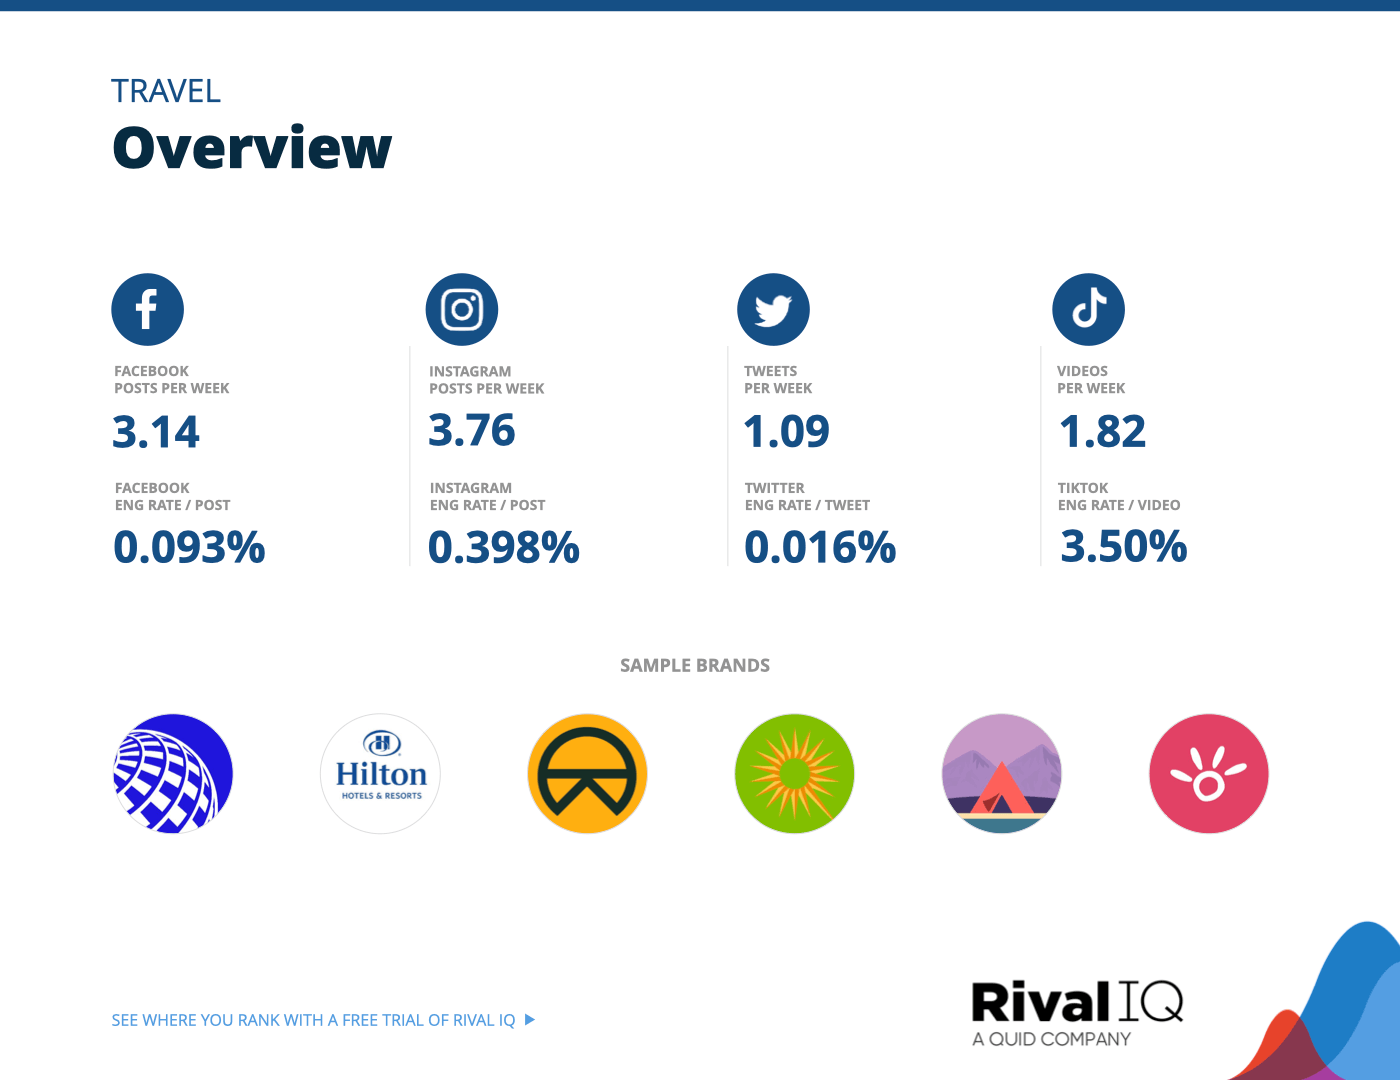
Overview of all benchmarks, Travel
Notable brands in this year’s report include Extra Holidays, GoRVing, Hotels by Hilton, Hipcamp, La Quinta, and United Airlines.
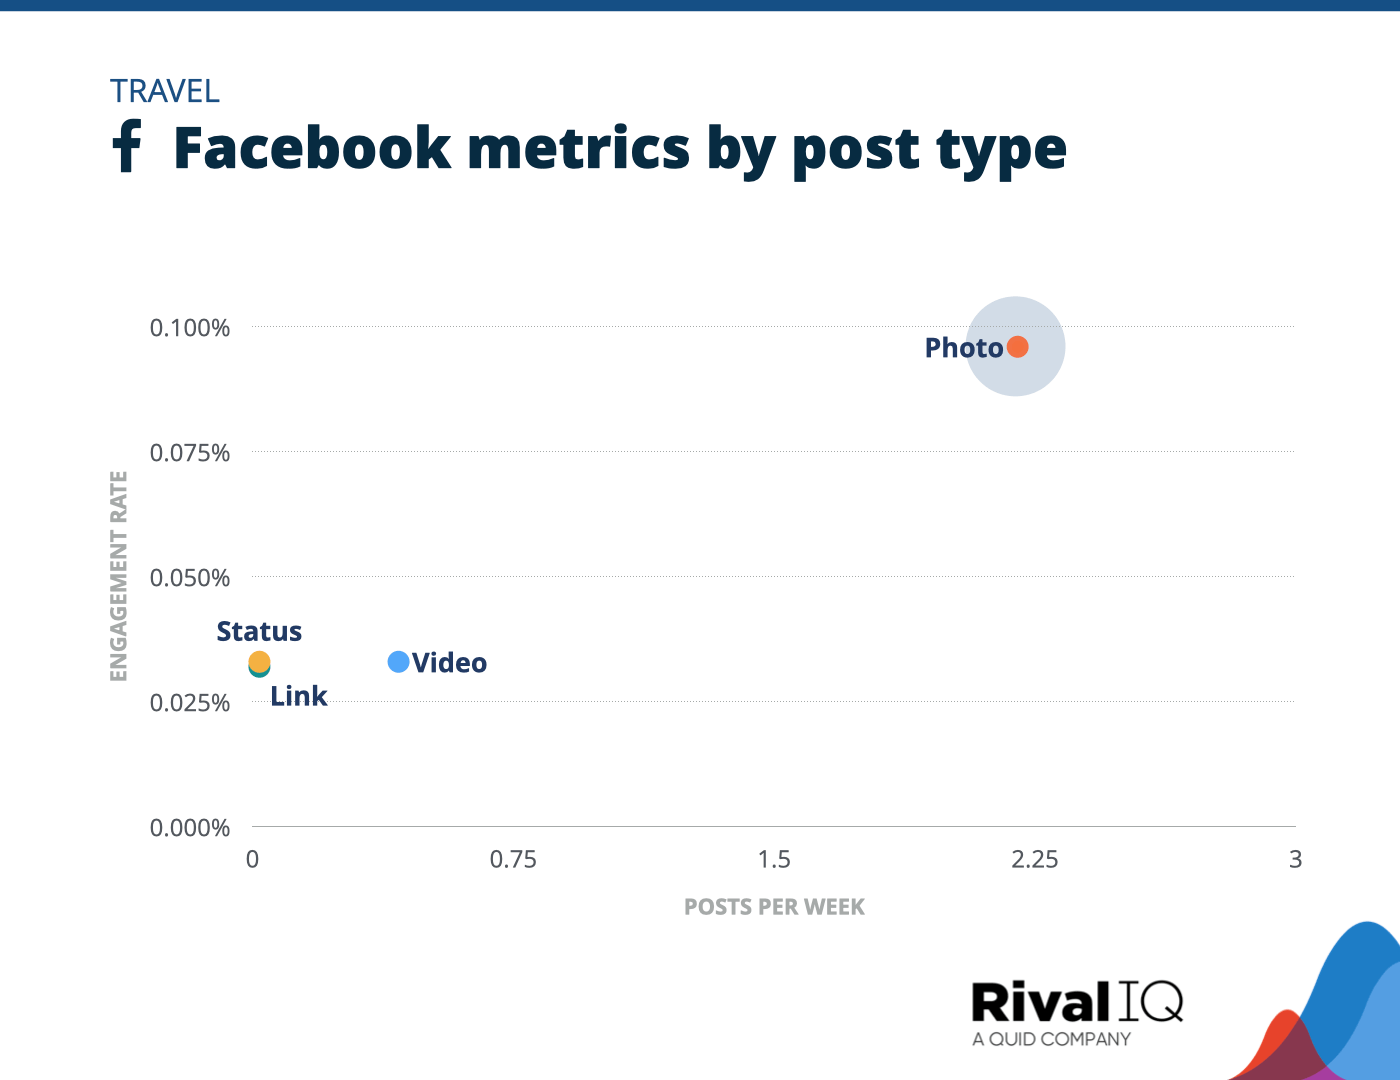
Facebook posts per week and engagement rate by post type, Travel
Photos were about twice as engaging as the next best post type on Facebook for Travel brands.
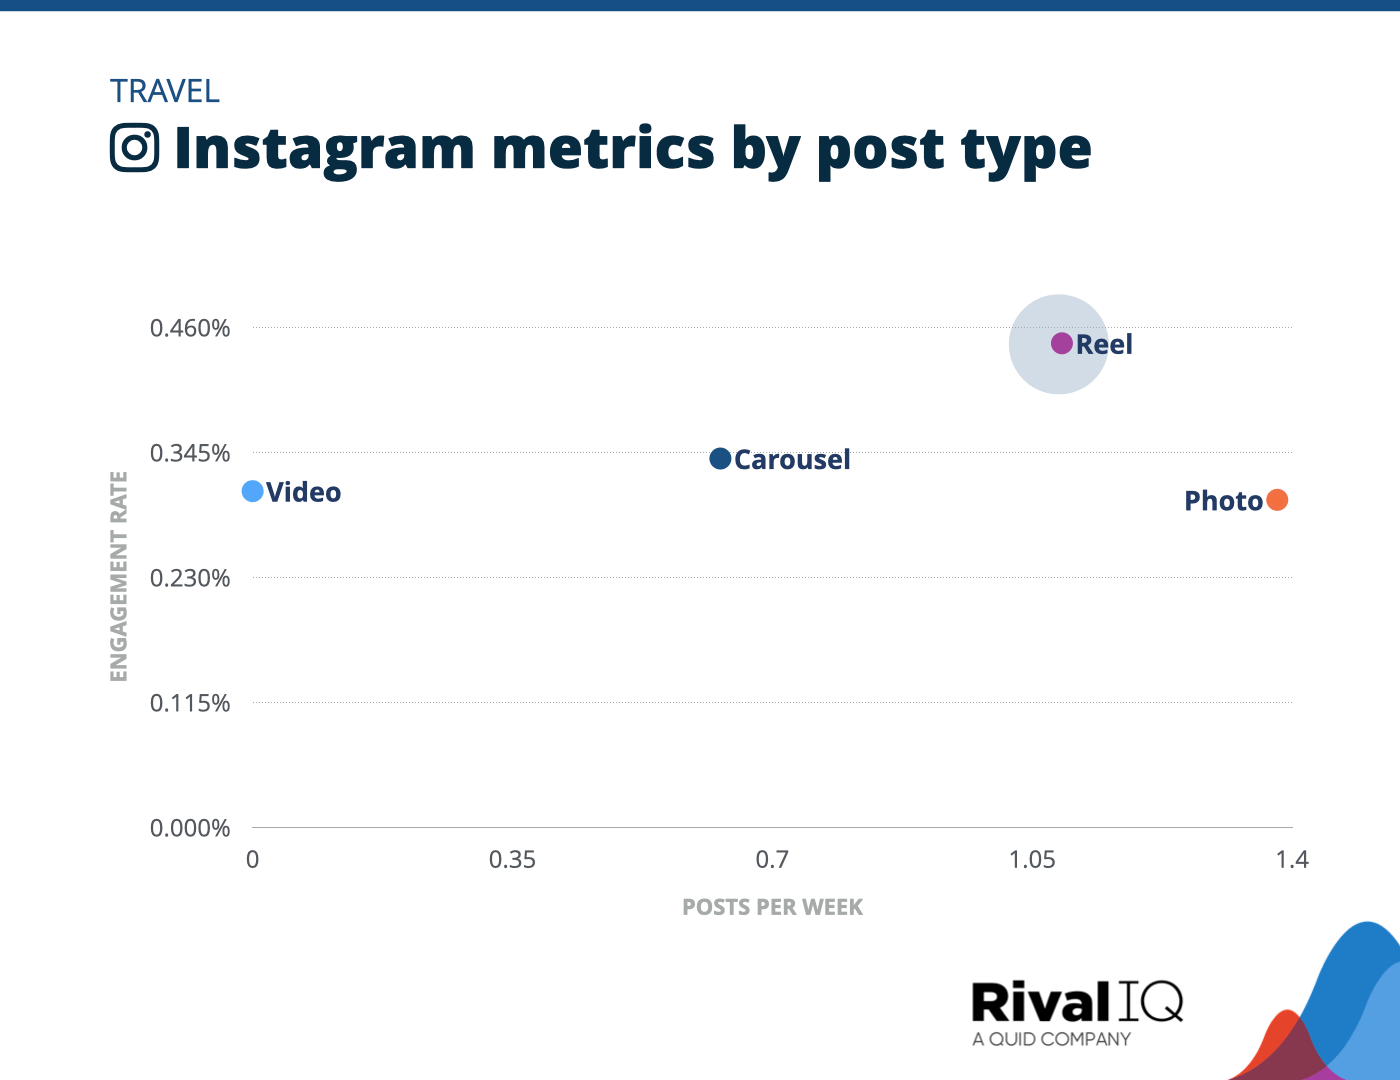
Instagram posts per week and engagement rate by post type, Travel
For the second year in a row, Reels outperformed other post types for Travel brands.
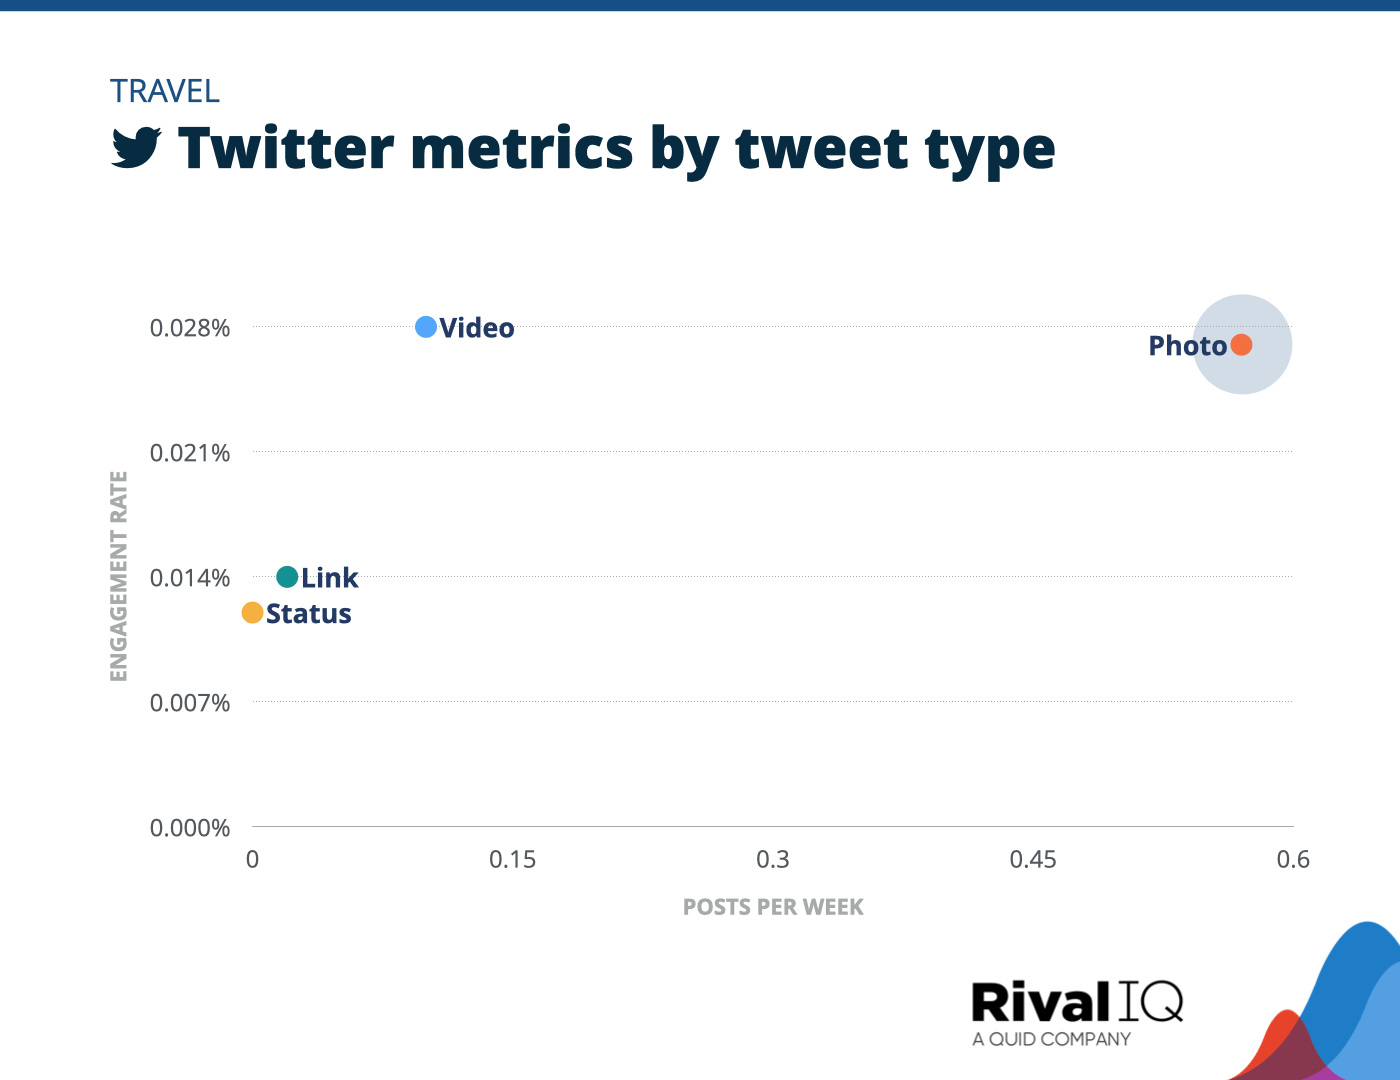
Twitter posts per week and engagement rate by tweet type, Travel
No surprise that it’s all about the visuals for Travel brands on Twitter, with video and photo tweets performing about twice as well as link and status tweets.
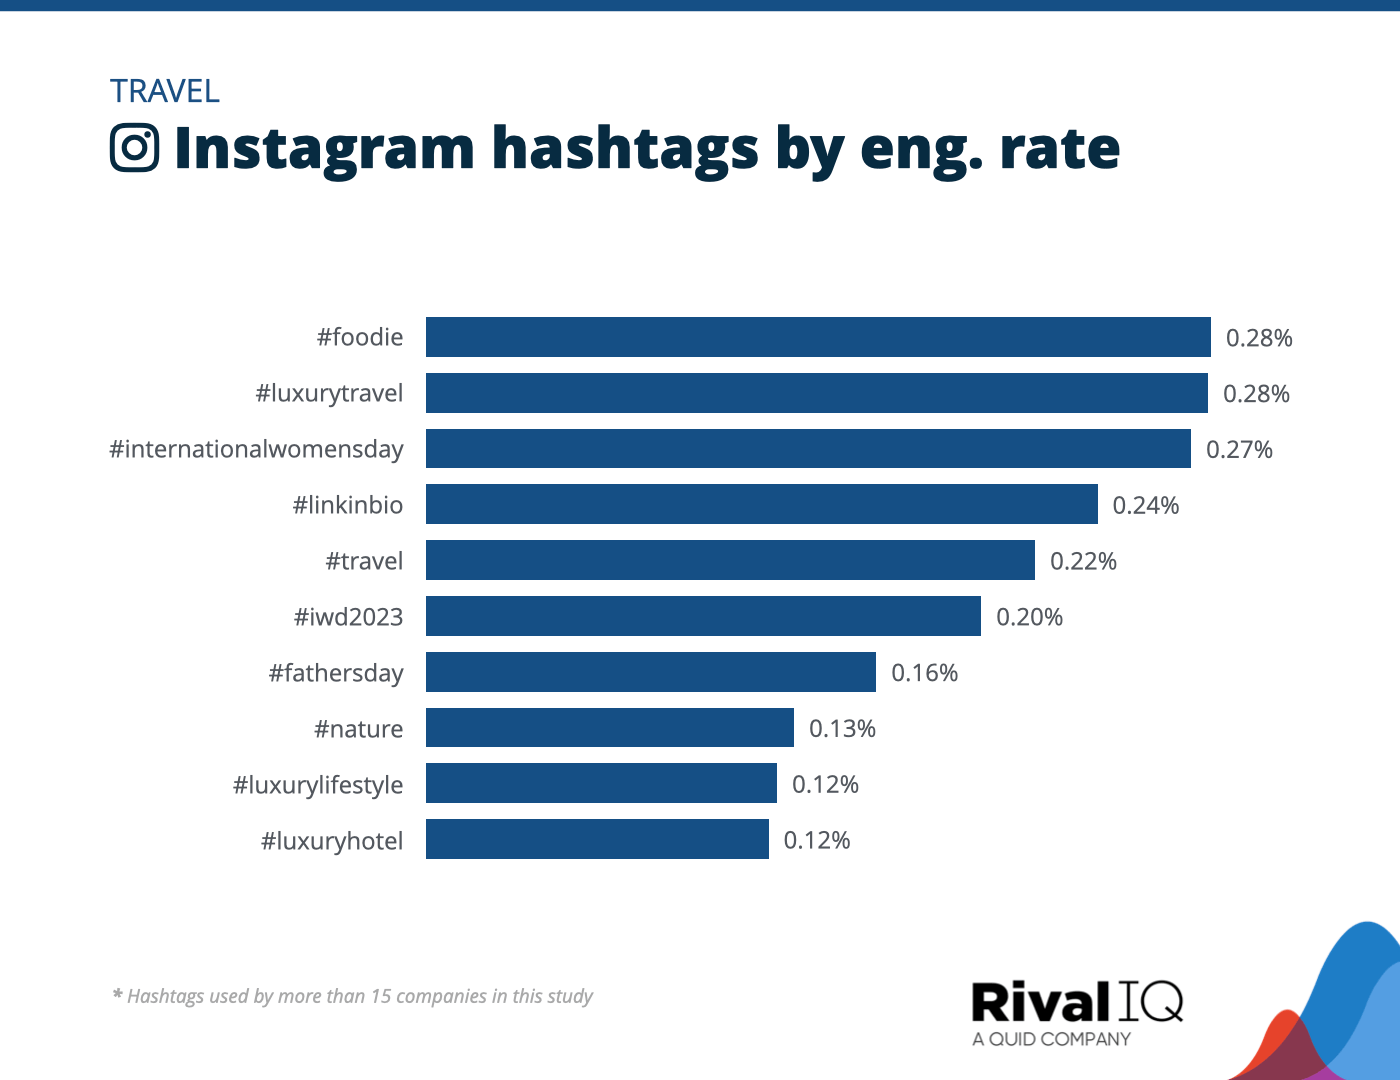
Top Instagram hashtags by engagement rate, Travel
Travel fans ate up hashtags like #LuxuryTravel and #LuxuryLifeStyle that helped them dream away the doldrums of day-to-day living.
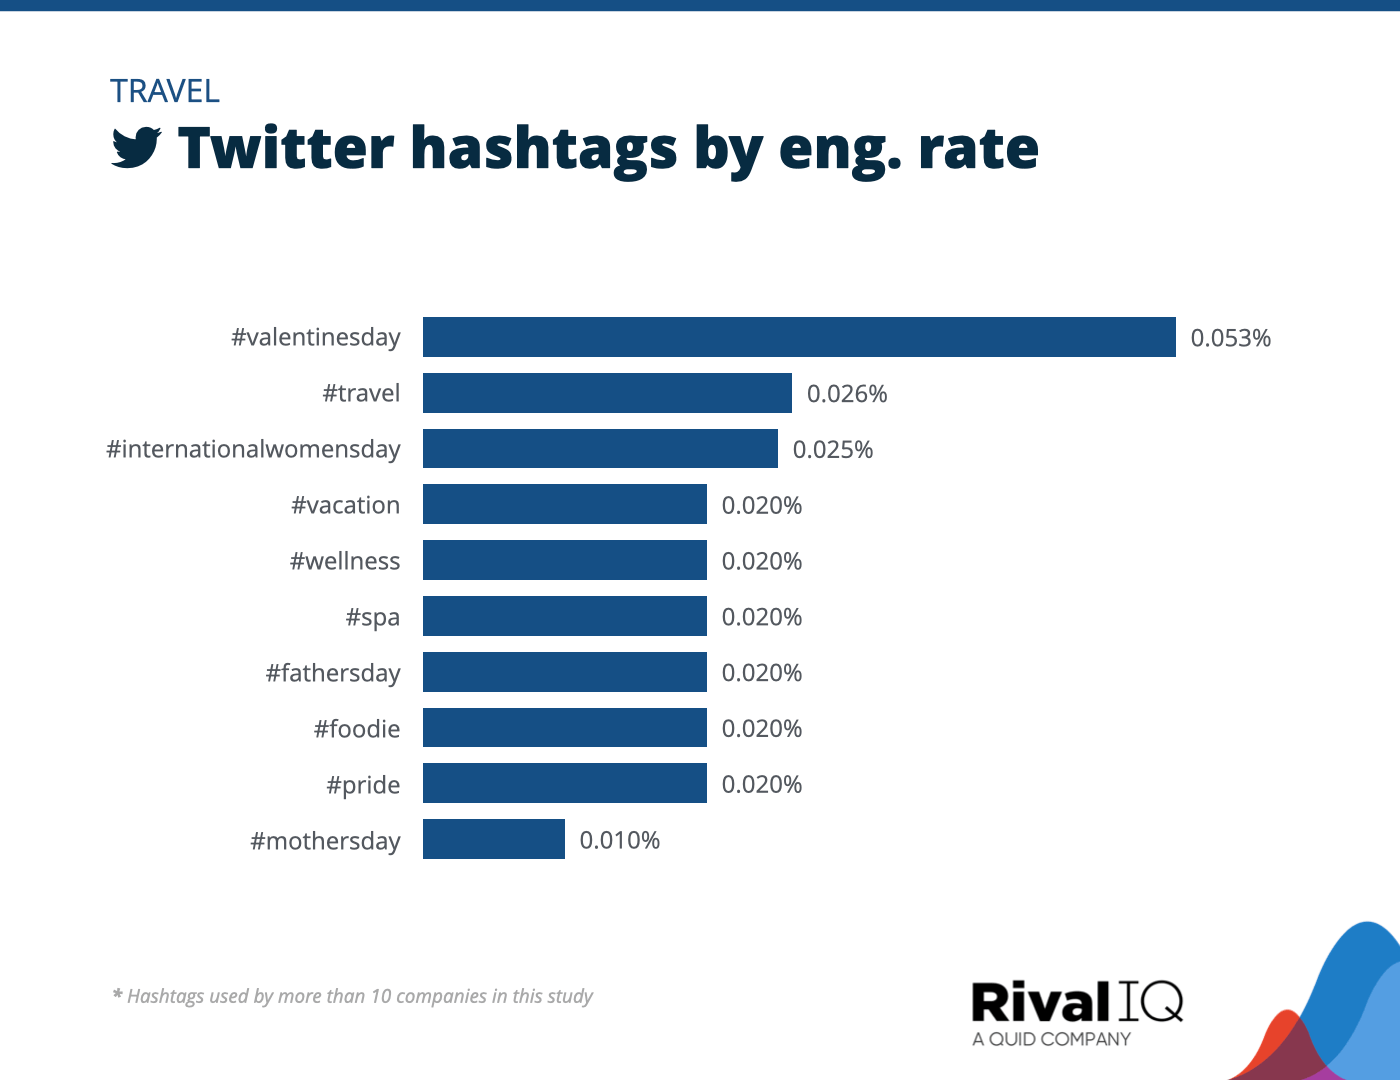
Top Twitter hashtags by engagement rate, Travel
Holiday-themed hashtags performed well for Travel brands on Twitter, especially all things #ValentinesDay.
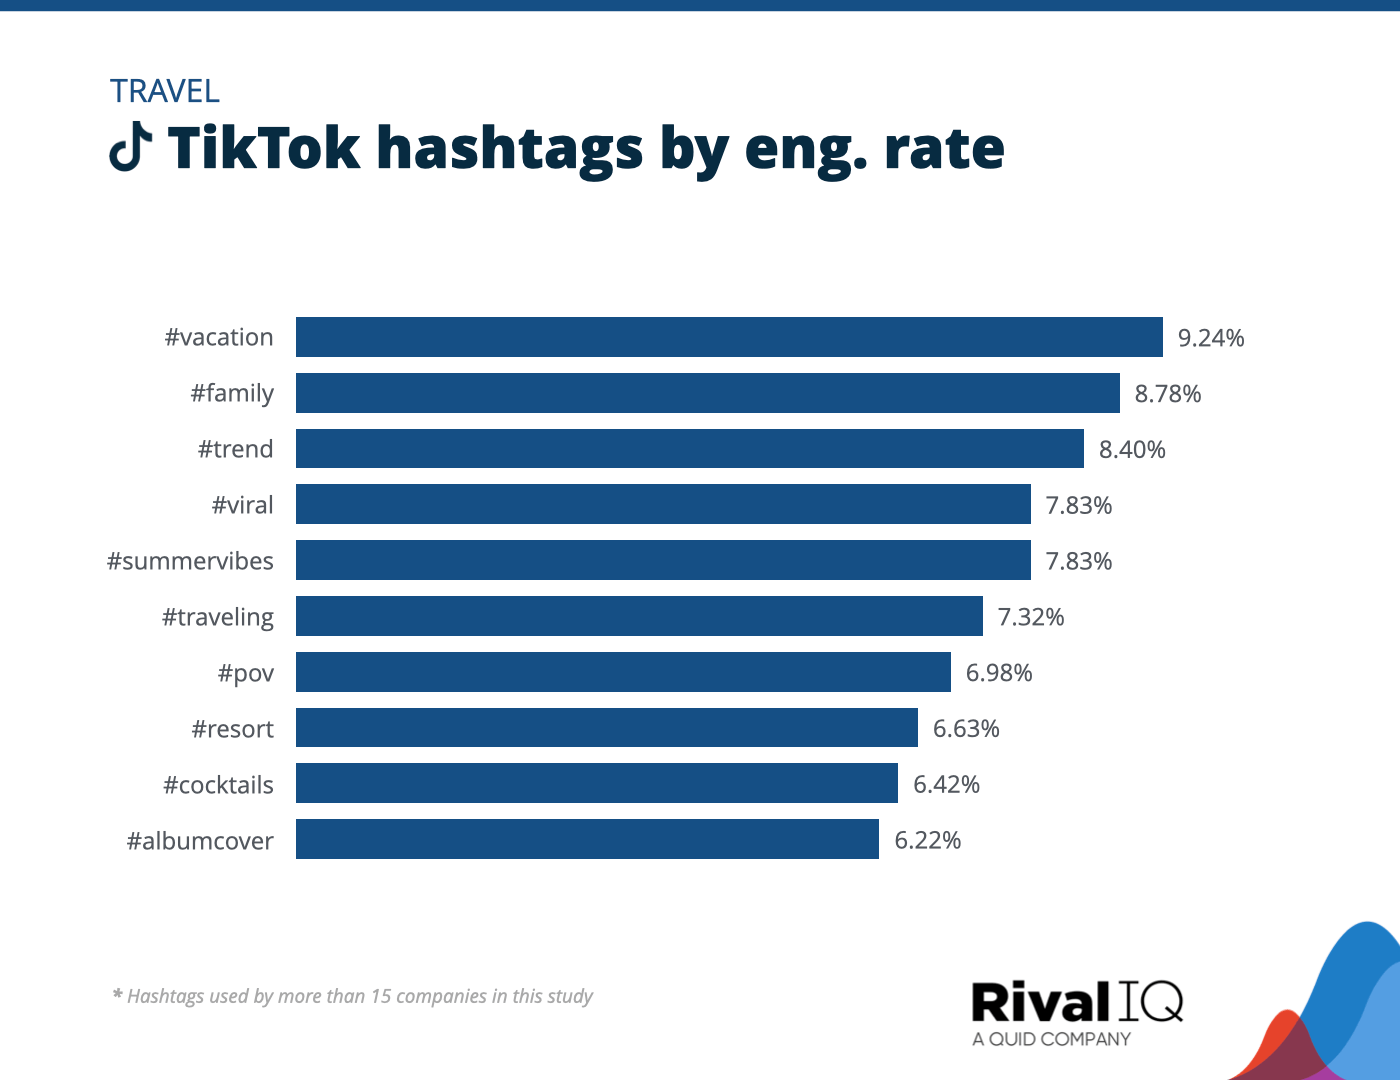
Top TikTok hashtags by engagement rate, Travel
No surprise that Travel brands focused on the destination this year on TikTok with hashtags like #vacation, #traveling, and #resort.
Methodology
To spot trends and identify benchmarks, we used Rival IQ to analyze engagement rates, posting frequency, post types, and hashtags on the top three social channels for brands: Facebook, Instagram, and Twitter.
We define engagement as measurable interaction on social media posts, including likes, comments, favorites, retweets, shares, and reactions. Engagement rate is calculated based on all these interactions divided by total follower count.

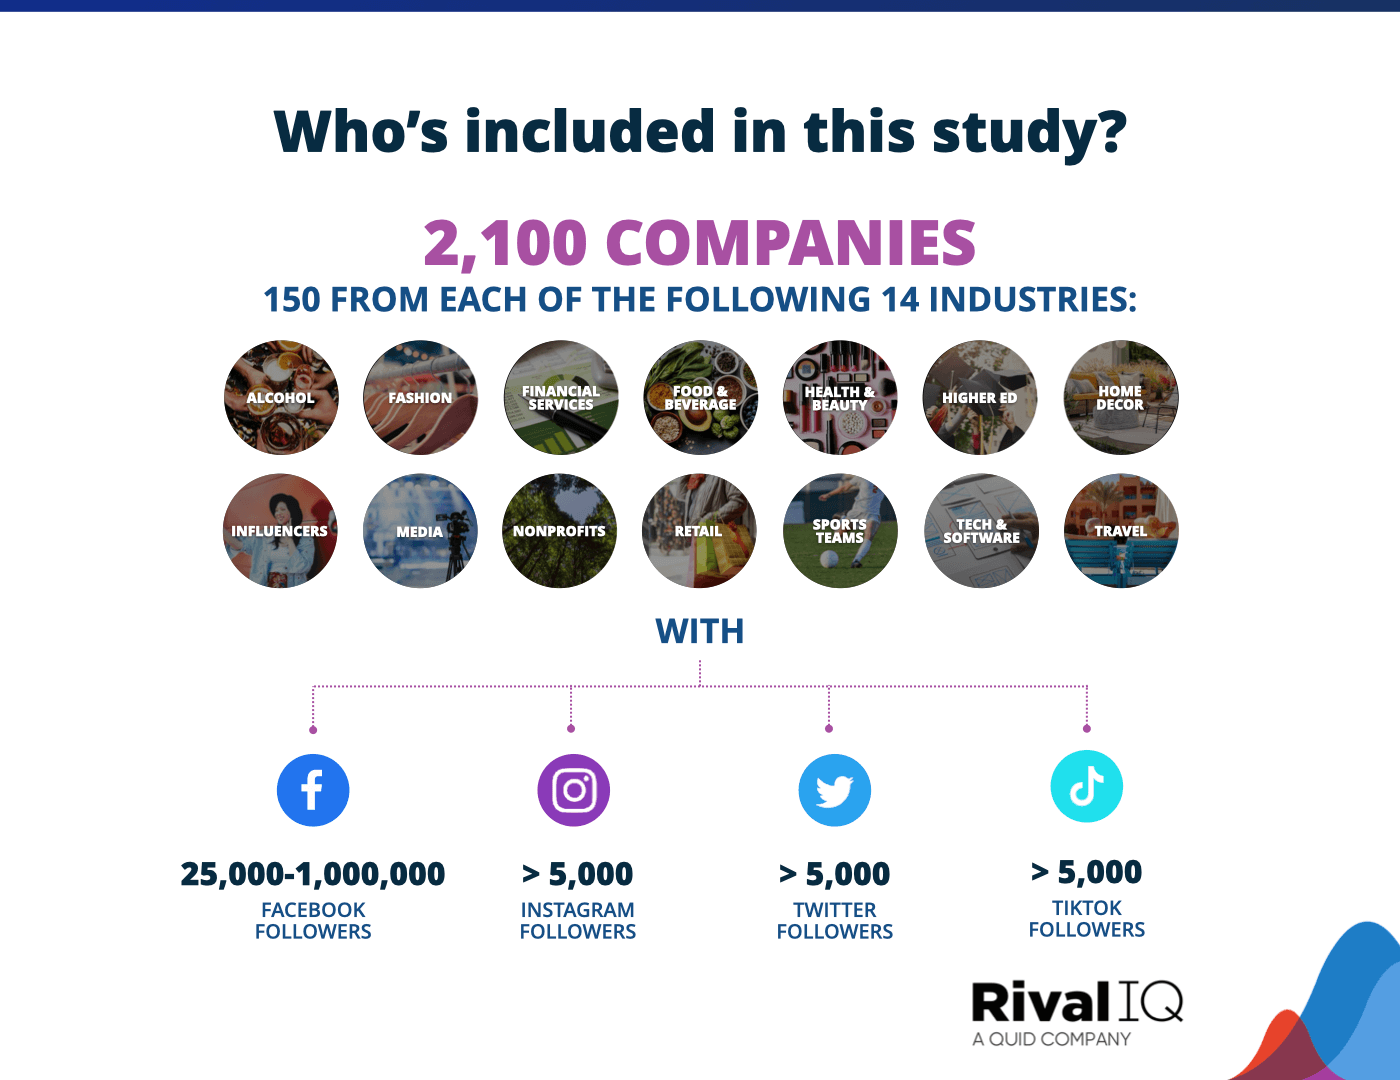
Within this report, we provide a representative sample of organic and paid posts from national and international companies in each industry by selecting 150 companies at random from each industry in our database of over 200,000 companies. Companies selected had active presences on Facebook, Instagram, and Twitter as of January 2023, and had Facebook fan counts between 25,000 and 1,000,000 and minimum Instagram and Twitter followers of 1,000 as of the same date.
We used median performance from the companies selected for each industry to compile the data for this report.
Why do we benchmark?
Social media success is about so much more than getting the most comments or likes: it’s about increasing engagement while also growing or maintaining the percentage of your audience that engages as you expand your audience.
To us, engagement rate per post is the metric because it controls for post volume and audience size and helps marketers understand how they’re doing in relation to their competitors.
Why can’t you gauge success on likes alone? Because audience size is hugely important: 1,000 likes makes a huge difference to a brand with 2,000 followers, but is a drop in the bucket to a brand with 100,000 followers.
Live Social Media Benchmarks
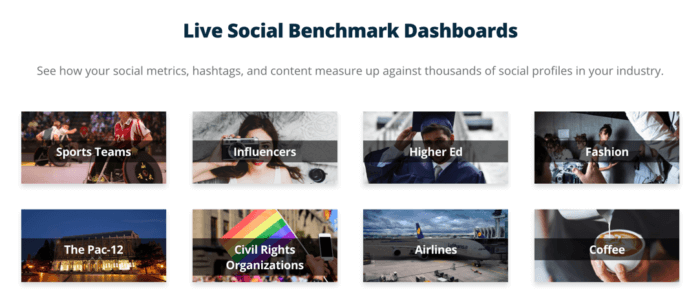
Ready to start benchmarking your social media performance? Check out our Live Benchmark landscapes, where we feature live social media metrics from a sample of companies from each industry represented in this study. These landscapes feature hashtag performance, top post types, and so much more on Facebook, Instagram, TikTok, and Twitter.
(Oh, and if you’re a Rival IQ customer or in a trial, you can add those stats directly into your Rival IQ account for even more comparisons.)
Or, run a free Head-to-Head report against your biggest rival to see how you measure up to both your competition and against industry benchmarks represented in this study.

Wrapping It Up
Everybody loves a little good news, so seeing Facebook engagement rates actually increase and watching brands invest even more in their Instagram and TikTok content left us feeling excited for what’s to come for social media in 2024.
What are your social media trend predictions for the year ahead? We’re listening on Twitter and Instagram!

Start analyzing with a free Rival IQ trial.
Get my free trial