The 2018 Higher Ed Social Media Engagement Report has arrived! For the third year in a row, we partnered with Up&Up, a Higher Education branding and marketing agency, to identify the most engaging Division 1 universities on social media.
This report ranks the top schools on social media overall and across Facebook, Instagram, and Twitter. Higher Ed institutions compete in more than just college sports, and this complete ranking honors the best in social media.
Along with the social media rankings, you’ll also learn which universities stayed at the top and which are moving up in the social media world. New this year is “The Biggest Leap Award”, which is given to the university with the greatest ranking improvement.
In this article, you’ll find the overall top 10 rankings and channel-specific winners for Facebook, Twitter, and Instagram. Plus, we’ve added bonus content including best practices and lessons from top universities and a look at consistent top performers from the last three years of this report.
See how your university stacks up in the 2018 Higher Ed Social Media Engagement Report.
Download the full report nowMethodology
We gathered data from 338 Division 1 institutions and analyzed their university-level account posts from June 2017 to May 2018. We used cross-channel performance, which is determined by engagement on Facebook, Twitter, and Instagram.
We define engagement as measurable interaction on social media posts, including likes, comments, favorites, retweets, shares, and reactions. Engagement rate is defined as the total engagement divided by audience size. For our study, we compute the average engagement rate on a per post basis for each university on a channel-by-channel basis. Rankings were then computed using a weighted score of audience, activity, and engagement (with a strong bias toward engagement).
Using this data and weighted formula, we generated an overall engagement ranking for each university. The top-ranked universities have high engagement rates with average or better audience size and posting volumes.
Understanding benchmarks for Higher Ed
Improving your social media performance is important, but how do you know if the numbers are good or bad?
This is why we benchmark. By incorporating benchmarks into your social reporting you can compare your performance to similar schools. We’re fans of directly comparing yourself to competitive schools, schools in your region, or even schools of similar size to establish context. But it’s also a good idea to benchmark yourself against the industry as a whole. Comparing your performance to the rest of your industry gives you the yardstick to measure whether it’s good or not.
Higher Ed earns high levels of engagement across social media channels, leading over other industries for the last two years and counting. With each social network relying increasingly on algorithms that favor engaging content (engagement begets engagement), colleges and universities are well-situated to remain at the top of their audience’s feed. Higher Ed marketers—and their budgets—can appreciate the opportunities to connect without paying to play.
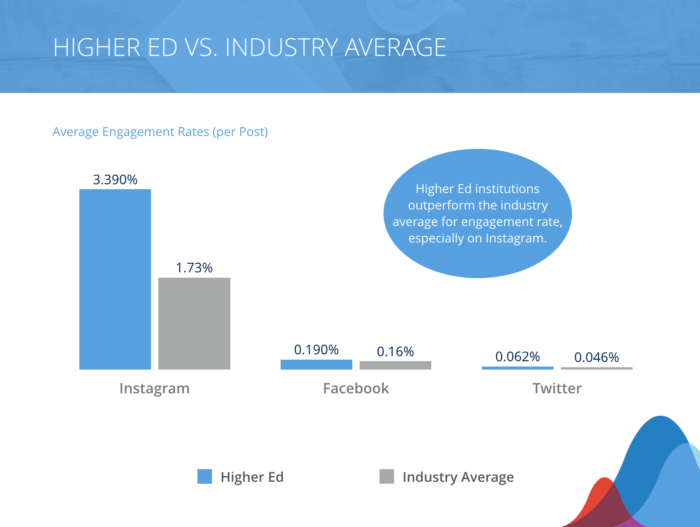
In our 2018 Social Media Industry Benchmark Report, the performance difference for Higher Ed is eye-popping. On average, these institutions outperform the industry average on each channel we studied. The most notable difference is on Instagram, where the average engagement rate per post of 3.39% is almost double the average of 1.73%.
The chart below shows the comparisons for each of Instagram, Facebook, and Twitter.
The rankings: Overall and by channel
Our overall social media rankings for these institutions comprises their rankings on Facebook, Twitter, and Instagram. In the following section, we review the overall rankings, then dive into each channel.
Overall Top 10
The top performing university on social media in this year’s report is James Madison University in Harrisonburg, VA. Though they didn’t top the ranks for any single channel, their top 10 performance on each individual channel catapulted them to the top of our overall rankings.
The rest of the top 10 universities also had consistently high performances across each channel.
| University | Overall Rank | Facebook Rank | Twitter Rank | Instagram Rank |
| James Madison University | 1 | 8 | 2 | 6 |
| Loyola University Chicago | 2 | 15 | 4 | 7 |
| University of Iowa | 3 | 1 | 25 | 21 |
| Xavier University | 4 | 10 | 14 | 24 |
| U.S. Military Academy | 5 | 28 | 1 | 38 |
| Villanova University | 6 | 16 | 30 | 11 |
| Colorado State University | 7 | 2 | 67 | 45 |
| The Citadel | 8 | 6 | 27 | 57 |
| Southern Utah University | 9 | 53 | 5 | 30 |
| Brigham Young University | 10 | 46 | 7 | 39 |
Facebook Top 10
The University of Iowa topped the Facebook rankings in this year’s report. They published almost 600 Facebook posts during the period we studied, and earned over 660K reactions, comments, and shares on those posts.
Colorado State, UVA, Jackson State, and Georgia Tech were our top 5 on Facebook.
| University | Facebook Rank | Page Likes | Facebook Posts | Total Number of Engagements |
| University of Iowa | 1 | 150,311 | 581 | 660,440 |
| Colorado State University | 2 | 156,891 | 390 | 790,247 |
| University of Virginia | 3 | 180,856 | 695 | 688,440 |
| Jackson State University | 4 | 92,358 | 573 | 323,146 |
| Georgia Institute of Technology | 5 | 145,545 | 251 | 356,996 |
| The Citadel | 6 | 35,623 | 500 | 161,544 |
| Clemson University | 7 | 210,446 | 720 | 742,766 |
| James Madison University | 8 | 90,305 | 448 | 259,982 |
| Quinnipiac University | 9 | 43,474 | 445 | 164,628 |
| Davidson College | 10 | 20,562 | 627 | 101,828 |
Facebook standout: The University of Iowa
Success on Facebook can feel out of reach and as the algorithms continue to shift, the median engagement rate of 0.16% can leave you feeling deflated. While Higher Ed sees a slightly higher average at 0.19%, it’s certainly not much of a comfort. Let’s look to one university who has broken from the pack to establish an average engagement rate of 0.87%, The University of Iowa. Jumping from #31 overall last year, they’ve moved 28 spots to claim #3 overall.
The University of Iowa consistently drove engagement this year on Facebook in several ways. From Hawkeye pride, to campus happenings, and of course, stunning campus photos, their social media feed is practically a best practices dream. But what stood out as a major contributor to this year’s success was The Wave.
The University of Iowa Stead Family Children’s Hospital overlooks the Kinnick Stadium field, with a space on the 12th floor that allows patients to watch all of the game day festivities. On home game days, they’re able to catch all of the action on the field, the marching band, and the crowd. At the end of the first quarter, the crowd faces the hospital and waves at the patients. This is The Wave, and it’s delighted Iowa fans.
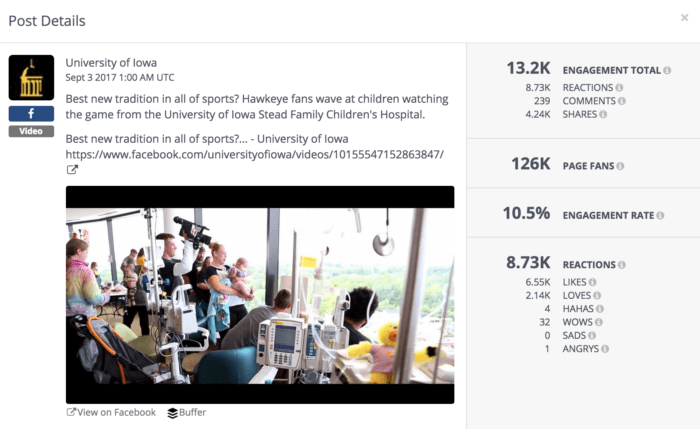
The University of Iowa captured and shared their newest tradition, The Wave. The reactions, shares, and comments flooded in — leading to a whopping 10.5% engagement rate.
Iowa rode that Wave (what? I had to.) all the way into the #1 spot in this year’s Facebook ranking. In the post shown above, we see The Wave in all its glory through video. Garnering over 13,000 engagements for an incredible engagement rate of 10.5%, this was only the beginning.
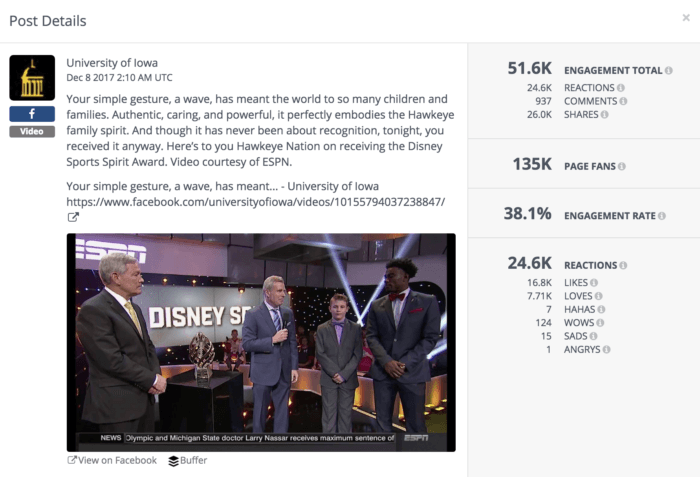
In another top post from Iowa, they celebrated the The Disney Spirit Award that was bestowed upon The University of Iowa during the College Football Awards Show. The video from the ceremony received 38.2% engagement rate — and for a good reason. You’ll need tissues for this one (and lots of them).
What started with Hawkeye fans caught the eyes of college sports fans across the nation, culminating with The College Football Awards Show on ESPN. The University of Iowa, and the Hawkeye Nation, were honored with The Disney Spirit Award for The Wave.
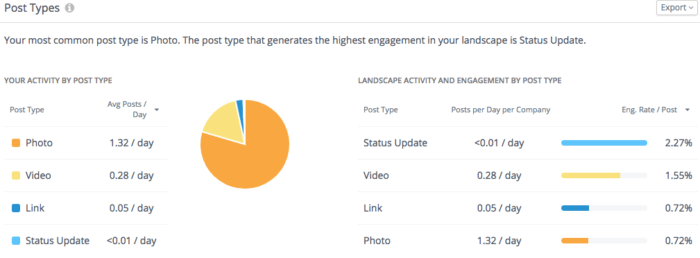
The University of Iowa drove steady engagement with video, averaging an engagement rate of 1.55% throughout the year.
The University of Iowa captured the hearts of fans nationwide with videos of The Wave, and they used video consistently to drive an average engagement rate of 1.55%. With almost 2 Video posts each week, this is similar to the overall Higher Ed average. You might be wondering why posts with the type of Status Update generated their highest engagement (I certainly was). It turns out, one status update gave the school year an impressive start.
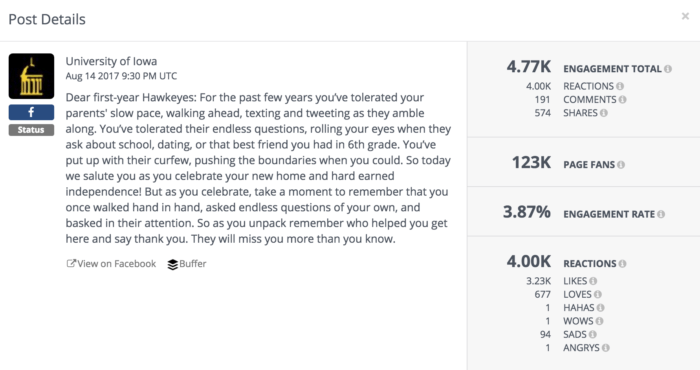
A thoughtful status update with a reminder to new Iowa students led to a 3.87% engagement rate.
This status update is a wonderful example of how good content can stand on its own — no need for a flashy video, jaw-dropping photo, or celebrity endorsement. Post something that will strike a chord in your audience; they’ll engage.
Here are a few best practices from Iowa that you can try:
- Capture your audience’s hearts
- Capitalize on video
- Create thoughtful, meaningful, and timely content
Twitter Top 10
On Twitter, The U.S. Military Academy topped the rankings at #1 this year, and the social team there is no stranger to this report. They’ve ranked in our Top 10 Overall for the last three years! You’ll note that a few other overall top performers from this year’s report appear in the top 10 for Twitter, too.
| University | Twitter Rank | Followers | Tweets | Replies |
| U.S. Military Academy | 1 | 81,724 | 585 | 23 |
| University of Maryland, Baltimore County* | 2 | 14,909 | 1,033 | 213 |
| James Madison University* | 2 | 52,133 | 432 | 300 |
| Loyola University Chicago | 4 | 35,501 | 499 | 85 |
| Southern Utah University | 5 | 4,439 | 915 | 250 |
| Grambling State University | 6 | 10,811 | 913 | 189 |
| Brigham Young University | 7 | 60,285 | 594 | 421 |
| Stephen F. Austin State University | 8 | 17,607 | 328 | 200 |
| Troy University | 9 | 23,662 | 500 | 4 |
| Prairie View A&M University | 10 | 15,917 | 1,230 | 96 |
Twitter standout: Brigham Young University
Twitter can be hard to crack for some social media managers. They personally abhor it, find the deluge of tweets overwhelming, or it may simply not resonate with them. Personal reasons aside, the numbers can have people scratching their heads. With a median engagement rate across all industries at .046% and Higher Ed just slightly better at .062%, it’s led some people to assume it’s a dying social media network.
But it doesn’t have to be this way. Case in point, Brigham Young University, who last year had a Twitter ranking of #5 and this year stayed in the top 10 at #7. Their performance caught my eye, as I noticed that for the last two years they tweeted just under 600 times. But most striking to me was that their replies are almost one for one with their tweets.
It’s easy to forget that Twitter is about communicating, often one-to-one. Here, we see that Brigham Young University not only tweets relevant content but also replies to comments and mentions. As one of only 4 institutions that remained in the Twitter top 10, this strategy is certainly working for them.
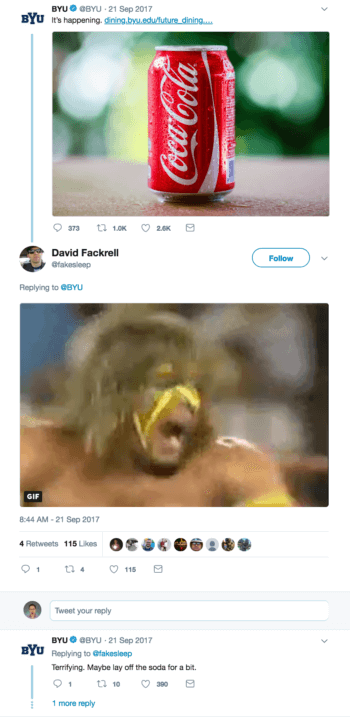
One well done reply can do a lot of good. Like this example that drew .76% engagement rate.
Brigham Young University had a few breakout posts, like the initial tweet above that topped their year’s engagement at 6.81%. But their average engagement rate of 0.33% isn’t solely the result of breakout tweets. (Remember, that’s impressive compared to the Higher Ed average of 0.062%)
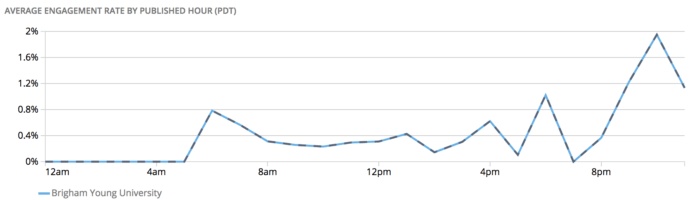
Examining the hours of the day that BYU gets engagement on Twitter, late night gets lots of action. Are you surprised that those “late-night” tweets drive the most engagement? Yeah, neither am I. When your primary audience is young college-age students, evening tweets make sense. Tweets in the 10 o’clock hour drive almost double the engagement at 1.95% compared to 1.02% during the 6 o’clock hour.
Overall, Brigham Young University approaches their Twitter with a rounded mix of professionalism and levity. Their posts and replies are direct, engaging, and when appropriate, use a little humor. It’s not off the wall like Wendy’s (or my personal favorite, Mt. St. Helens), but they do give an air of nonchalance when they see fit.
Here are a few best practices from BYU that you can try:
- Prioritize conversation over promotion
- Tweet when your audience is active
- Inject personality with a sense of humor
Instagram Top 10
For Higher Ed, Instagram is the channel that really shines, with average engagement rates (on a per post basis) topping 3% on average.
In this year’s report, the University of Vermont claims the top spot, with their 7.6% engagement rate average over the 296 posts during the reporting period. Again, we see JMU and Loyola of Chicago appearing here in the top 10.
| University | Instagram Rank | Followers | Posts | Avg. Engagement Rate per Post |
| University of Vermont | 1 | 26,351 | 296 | 7.60% |
| Binghamton University | 2 | 22,416 | 298 | 7.45% |
| California Polytechnic State University | 3 | 34,696 | 170 | 8.75% |
| Wake Forest University | 4 | 26,570 | 398 | 6.90% |
| Northern Arizona University | 5 | 33,935 | 376 | 6.70% |
| James Madison University | 6 | 33,774 | 259 | 7.30% |
| Loyola University Chicago | 7 | 22,959 | 184 | 8.00% |
| UCSB | 9 | 34,548 | 65 | 10.20% |
| Holy Cross | 8 | 11,062 | 199 | 9.70% |
| U.S. Naval Academy | 10 | 91,135 | 245 | 6.60% |
Instagram standout: The University of Vermont
Instagram is where universities shine the most on social media. Unlike other industries that have a median engagement rate of 1.73%, Higher Ed outpaces with a 3.39% engagement rate. This may be why institutions like The University of Vermont have focused their social strategies on Instagram. As many of us know, sometimes you can’t win them all – so focusing on where you can invest resources and be successful is the best route.
For The University of Vermont, which moves up from #4 in 2017, there are several Instagram strategies they’re utilizing in tandem. From stunning campus shots that include breathtaking sunsets, gothic buildings softened by a blanket of snow, and even rainbows over field hockey, The University of Vermont shows their campus in the best light. But this effort isn’t theirs alone.
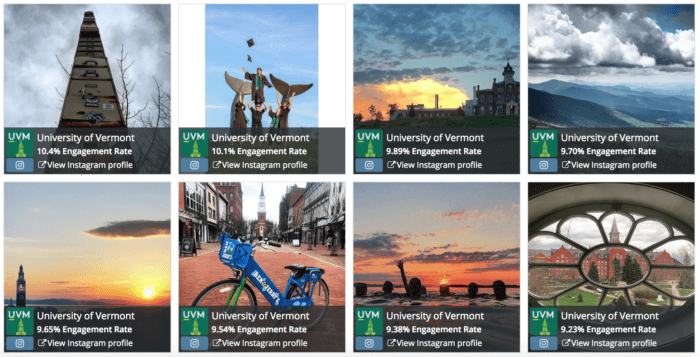
Each photo above is user-generated content (UGC) and garnered impressive engagement.
Over 84% of Vermont’s Instagram posts are attributed to other Instagrammers, including current and former students, faculty and staff, and visitors. Each of these user-generated content (UGC) posts include a ?(camera emoji) followed by photo credit, along with the hashtag #instauvm. The hashtag alone has over 9,000 posts.
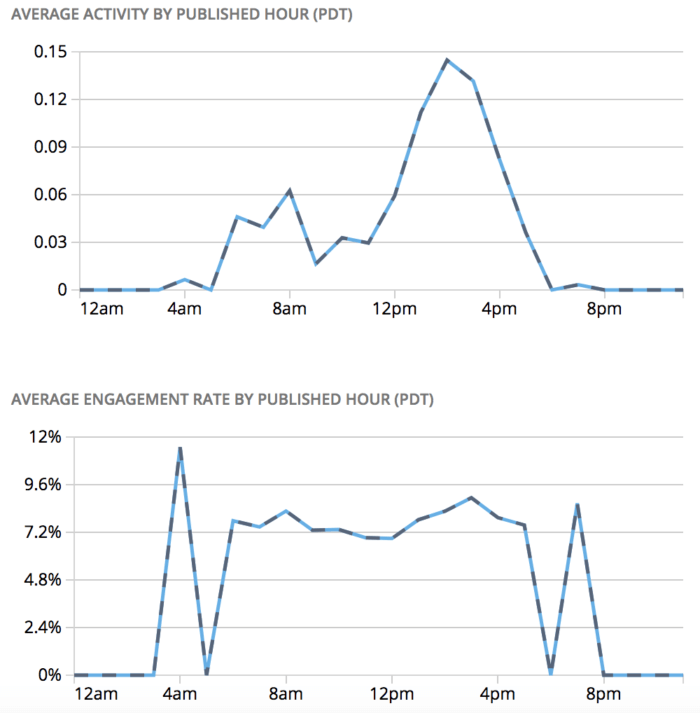
Is there a “best time to post”? For The University of Vermont it seems that any time is the best time to post.
It’s rare to find a social profile that doesn’t have dips in their engagement related to posting times.Digging into when the University of Vermont posts, they have perfected their content to the point of practically guaranteeing high engagement. The only dips we see in the above graph are in the hours they don’t post at all.
Here are a few best practices from Vermont that you can try:
- Leverage user-generated content
- Post consistently high-quality content
Want even more benchmarks? Check out the 2019 Social Media Industry Benchmark Report.
Download the report nowThree-Peats: Our most consistent performers
This is the third year we’ve created this report, and quite a few of the institutions in our report have appeared consistently near the top of the rankings. Though we didn’t include this particular award category in our full report, we wanted to recognize the social media teams that have performed reliably well since 2016.
These 23 Universities have been in the top 50 overall each of the last three years. Only two of them have held their honors within the top 10 overall, #1 James Madison University and #5 U.S. Military Academy. But my eyes are on #4 Xavier University and #9 Southern Utah University. These two institutions have continued to climb the rankings each year.
| University | 2018 Rank | 2017 Rank | 2016 Rank |
| James Madison University | 1 | 3 | 7 |
| University of Iowa | 3 | 31 | 6 |
| Xavier University | 4 | 9 | 13 |
| U.S. Military Academy | 5 | 5 | 8 |
| Villanova University | 6 | 27 | 12 |
| Colorado State University | 7 | 22 | 23 |
| Southern Utah University | 9 | 18 | 21 |
| Brigham Young University | 10 | 8 | 20 |
| Virginia Military Institute | 11 | 11 | 25 |
| Northern Arizona University | 13 | 1 | 1 |
| California Polytechnic State University | 15 | 12 | 33 |
| Oregon State University | 16 | 24 | 19 |
| Holy Cross | 17 | 20 | 29 |
| Elon University | 19 | 21 | 27 |
| William & Mary | 24 | 28 | 24 |
| U.S. Naval Academy | 25 | 6 | 8 |
| Georgia Institute of Technology | 26 | 16 | 9 |
| Campbell University | 32 | 13 | 30 |
| University of Dayton | 34 | 4 | 4 |
| Clemson University | 35 | 17 | 2 |
| Duquesne University | 36 | 26 | 14 |
| Texas A&M University | 46 | 38 | 10 |
| Quinnipiac University | 50 | 15 | 28 |
From a learning perspective, it’s useful to ask: What do each of these three-peats have in common?
While each institution has unique reasons for their continued success, there are a few commonalities that bubble up. If you want to ensure your social media accounts consistently draw engagement keep these tactics in the forefront.
Here are some best practices from our three-peats that you can use to improve your social performance:
- Post daily, consistently
- Mix branded/custom and related hashtags for discoverability
- Leverage high-quality images and videos
- Use post types that regularly drive high engagement
- Pinpoint the content that works for your audience
Where does your university rank?
If you’re curious where you ranked in the 2018 Higher Ed Report, access the full rankings on Tableau Public.
To get all of the report details, download your copy of the full 2018 Higher Ed Social Media Report.
Live social benchmarks for Higher Ed
If you’re interested in social media benchmarks throughout the school year, check out our live Higher Ed social media benchmarking landscape. Here, you’ll find activity and engagement benchmarks, top posts, and more.
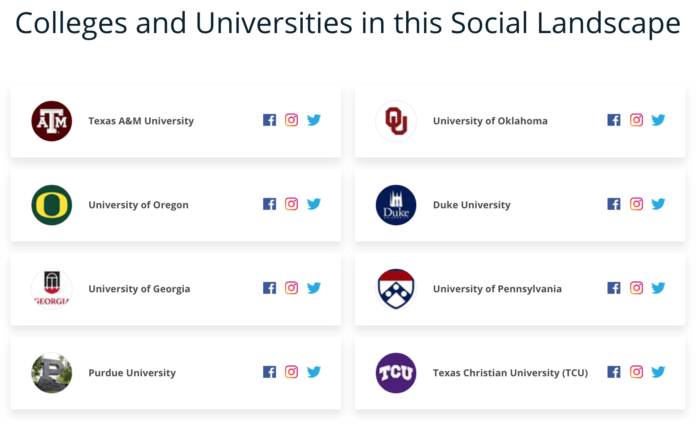
Universities in our Live Benchmarks
